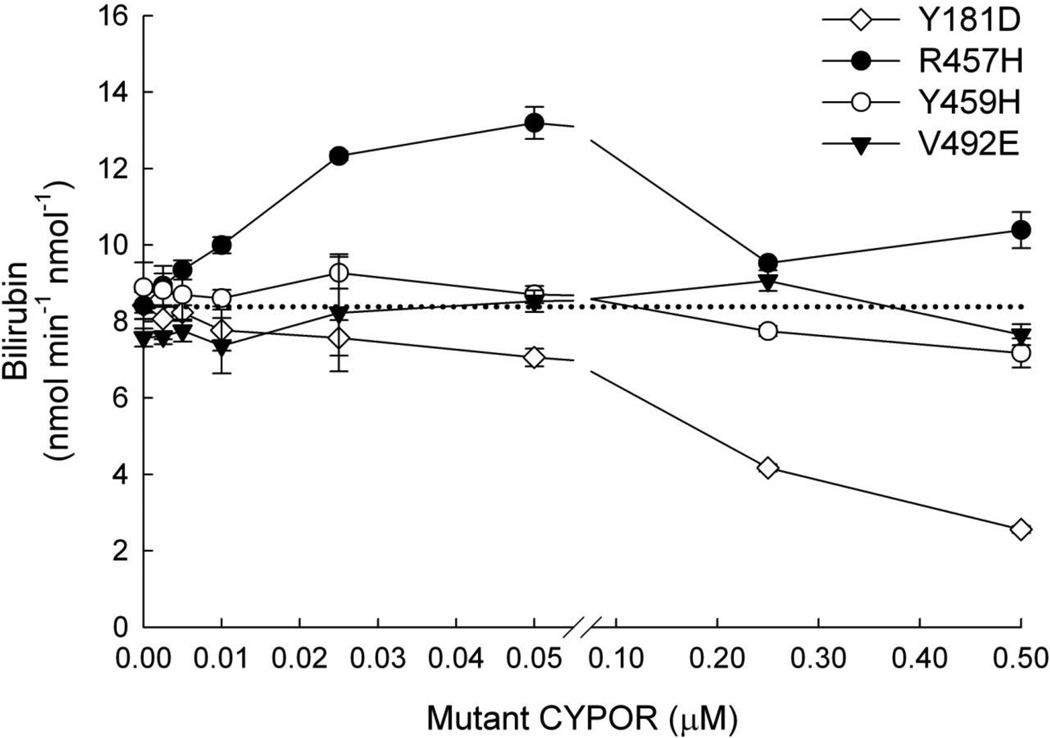
Figure 4. Titration of WT CYPOR-HO-1 Complex with CYPOR Variants.
Reconstituted systems were prepared with [WT CYPOR] = 0.005 µM, [HO-1] = 0.05 µM, and varying concentrations of Y181D, R457H, Y459H, or V492E variants of CYPOR. Each system was assayed for HO-1 activity. Each point on the plot represents the mean ± standard deviation of triplicate assays. The dashed line represents the baseline rate of reaction of the system without addition of the variant CYPOR.

