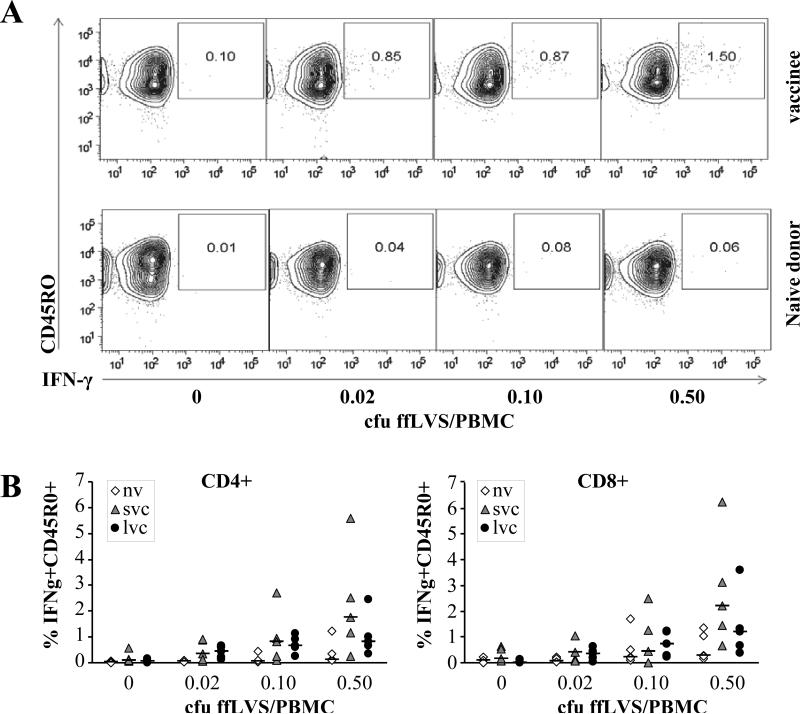
Figure 3.
Frequency of IFNγ expressing memory T cells in recall stimulated PBMC. A) Representative elevation curve plots for samples from one vaccinee (upper panels) and one naïve individual (lower panels). B) Scatter plots summarizing results from five individuals in each donor group (nv: PBMC from naïve individuals, svc: PBMC from were from donors vaccinated less than three years ago, lvc: PBMC from 27-34 years ago). Horizontal bars mark the mean of each sample group. Intracellular cytokine staining and flow cytometry analysis of T cell subsets was performed after 48 h of stimulation with indicated concentrations of cfu ffLVS/PBMC. Lymphocytes were gated from live cells according to forward and side scatter and subsequently CD4 and CD8 T cells were gated as CD3+CD4+ or CD3+CD8+, respectively.

