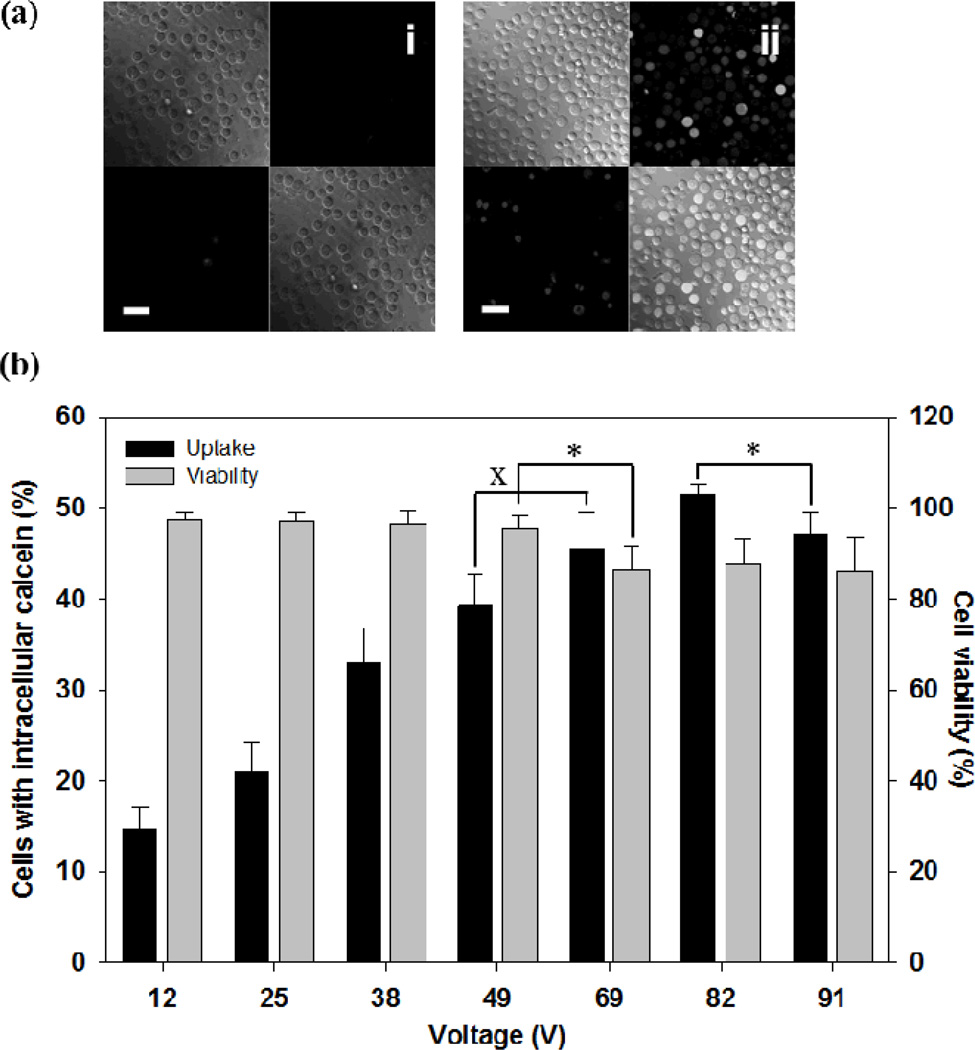
Figure 3.
Effect of voltage on intracellular calcein uptake after electroporation with a microneedle electrode device. (a) Representative confocal microscopic images of human prostate cancer cells after the delivery of calcein by electroporation using a 2.5 ms exponential decay pulse. Each picture contains 4 sections, and each section represents an image taken by a different channel (top left: brightfield, top right: green fluorescence, bottom left: red fluorescence, bottom right: combination of all channels). Cells with intracellular calcein show green fluorescence and dead cells are marked by red fluorescence. Additional images can be seen in Supplemental Figure S1. (i) Unpulsed control, (ii) 69 V (scale bar = 50 µm). (b) Uptake efficiency of calcein and cell viability using 2.5 ms exponential decay pulse at different voltages. Data represent the average of n=3 replicate experiments. Standard deviation bars are shown. × not significantly different (Student’s t-test, p > 0.05), * significantly different (Student’s t-test, p < 0.05)

