Figure 4.
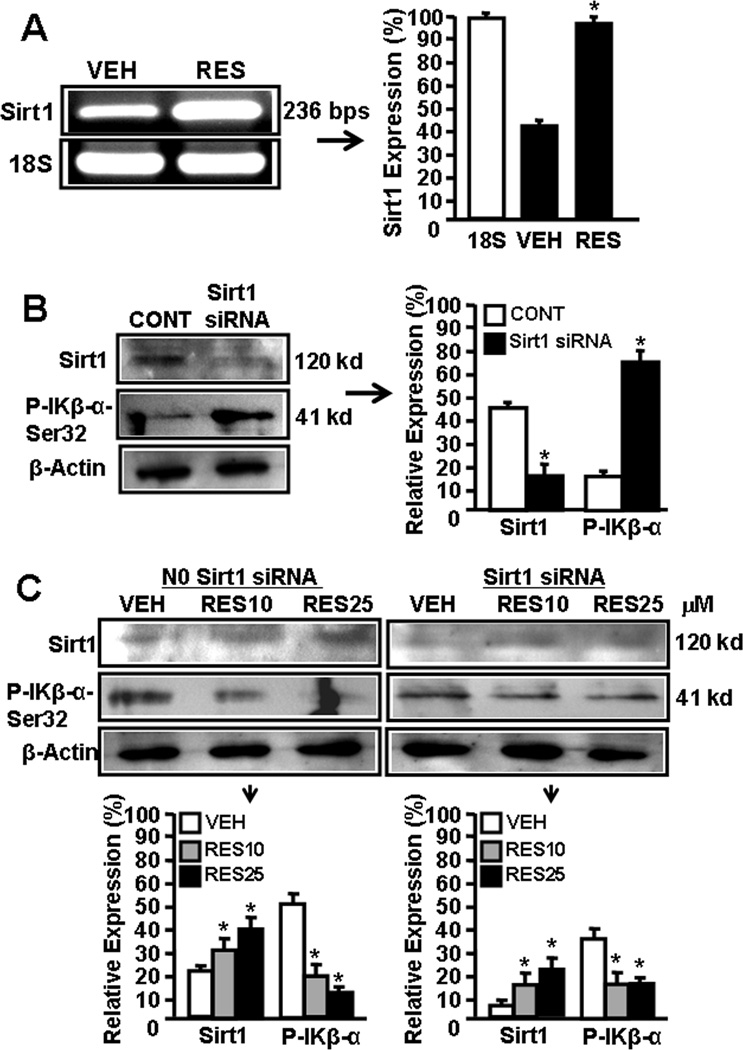
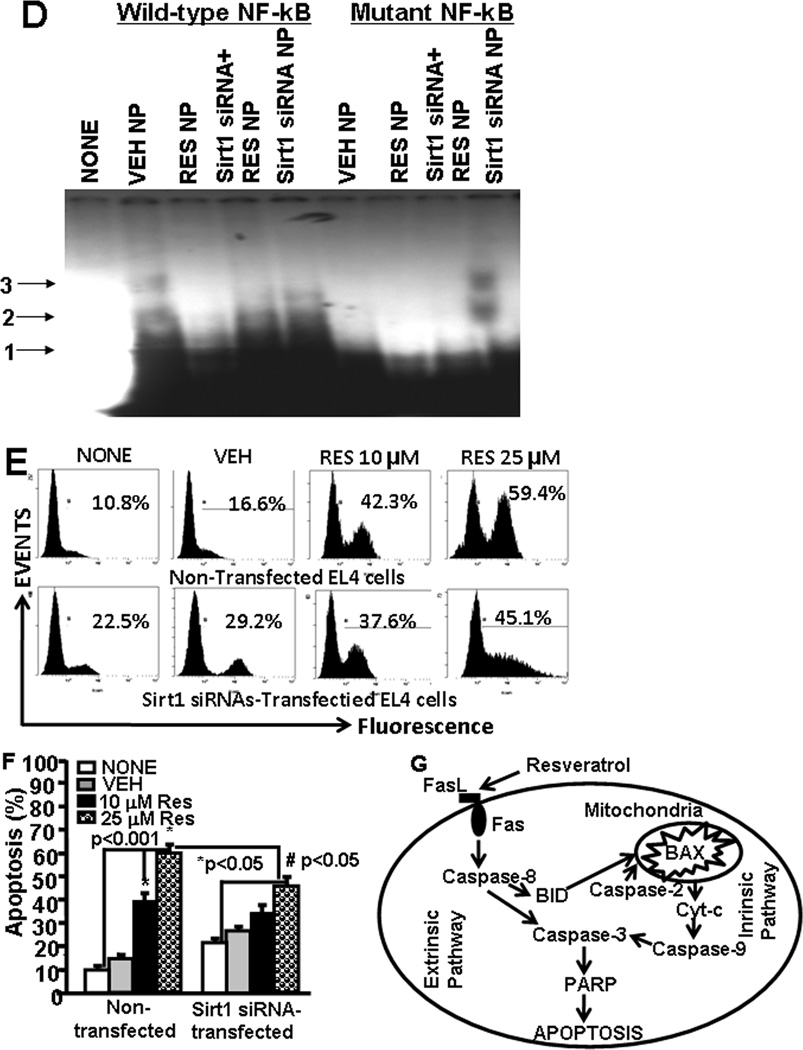
SIRT1 expression in EL4 cells regulates NF-kB activation and apoptosis. Expression of SIRT1 in EL4 cells was determined by performing RT-PCR. A, Expression of SIRT1 in EL4 cells 6 hrs post vehicle or RES treatment (RT-PCR). 18S, a house keeping gene, was used as a positive control. In panel B, the bars represents mean ± SEM of three independent experiments and asterisks (*) represent significant (p < 0.05) difference between RES-treated EL4 cells when compared to vehicle-treated EL4 cells. B, cytosolic proteins from EL4 cell untransfected or transfected with mouse SIRT1-specific siRNAs were fractionated in polyacrylamide gel and expression of SIRT1 and p-IKβα-Ser32 was analyzed by Western blotting using antibody against mouse-specific SIRT1 and p-IKβα-Ser32. Expressions of SIRT1 and and p-IKβα-Ser32 is presented as percentage of β-Actin expression on Y-axis and expression of β -Actin was considered to be 100% for each experiment. Vertical bars represent mean +/− SEM of three independent experiments and asterisks (*) represent statistically significant (p < 0.002) reduction in expression of SIRT1 (untransfected control; CONT vs SIRT1 siRNA transfected EL4 cells) and an increase in expression of p-IKβ-α-Ser32 (untransfected control; CONT vs SIRT1 siRNA transfected EL4 cells) in EL4 cells. C, cytosolic proteins from EL4 cell untransfected or transfected with mouse SIRT1-specific siRNAs and treated with vehicle or RES were fractionated in polyacrylamide gel and expression of SIRT1 and p- IKβα-Ser32 in EL4 cells was analyzed by Western blotting using antibody against mouse-specific SIRT1 and p-IKβα-Ser32. Left panel in C represents expressions of SIRT1 and p-IKβα-Ser32 in untransfected EL4 cells and treated with vehicle or RES whereas right panel represents expressions of SIRT1 and p-IKβα-Ser32 in EL4 cells transfected with SIRT1 siRNA and treated with vehicle or RES. The vertical bars represent percentage of β-actin expression which was considered to be 100%. Also, vertical bars represent mean +/− SEM of three independent experiments and asterisks (*) represent statistically significant (p < 0.002) increase in expression of SIRT1 (VEH vs RES10 or RES25 µM) and decrease in p-IKβα-Ser32 (VEH vs RES10 or RES25 µM). D, EMSA analysis of NF-kB motif. Double stranded probes containing wild-type NF-kB or mutant NF-kB motifs were generated and nuclear extracts (4–5 µg) generated from vehicle- or RES-treated untransfected or SIRT1 siRNA-transfected EL4 cells not treated or treated with RES was used in each reaction. Radiolabeled (P32) wild-type or mutant NF-kB1 probes were used either without incubation with nuclear extracts or after incubation with nuclear extracts. Arrows 1 represents free probes and arrows 2 and 3 represent NF-kB+ nuclear protein (NP) complexes. E, EL4 cells non-transfected or transfected with SIRT1 siRNA were cultured in the presence of vehicle or RES (10 or 25 µM) for 24 hrs and apoptosis was determined using TUNEL assay. F, Vertical bars in the left panel of E represent mean +/− SEM of three independent experiments and asterisks (*) represent statistically significant (p< 0.001) increase in apoptosis in non-transfected EL4 cells or SIRT1-siRNA transfected EL4 cells post RES treatment compared to vehicle-treated cells and (#) represents statistically significant (p< 0.05) decrease in apoptosis in SIRT1-siRNA transfected EL4 cells post RES treatment compared to untransfected EL4 cells. G, Schematic diagram demonstrating pathways involved in RES-mediated apoptosis in EL4 cells.


