
Figure 4. Amplified activation potency of FGK-LPSiNPs compared to free FGK45.
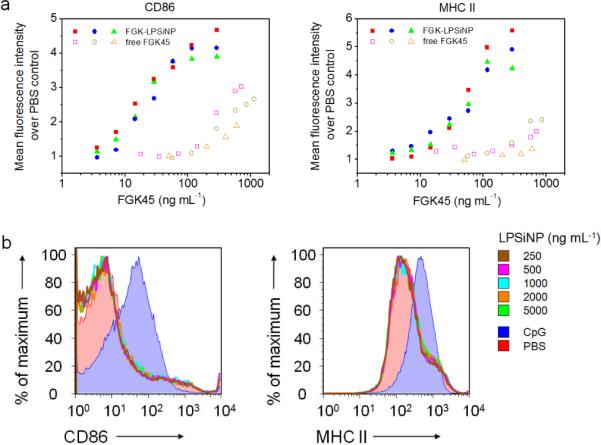
a) Flow cytometry analysis of the expression of B cell activation markers CD86 and MHC II, represented as the relative mean fluorescence intensity of the marker staining, after incubation with either FGK-LPSiNPs or free FGK45 for 42 h at 37 °C. The concentration of FGK45 on the FGK-LPSiNP constructs is reported based on the total loading of FGK45 on the nanoparticles (58 μg of FGK45 per mg of nanoparticles). Data are from independent experiments. b) Flow cytometry histograms of B cell activation markers CD86 and MHC II after incubation with various concentrations of LPSiNPs for 42 h at 37 °C. PBS (red shaded) and CpG (blue shaded) were used as negative and positive controls, respectively.