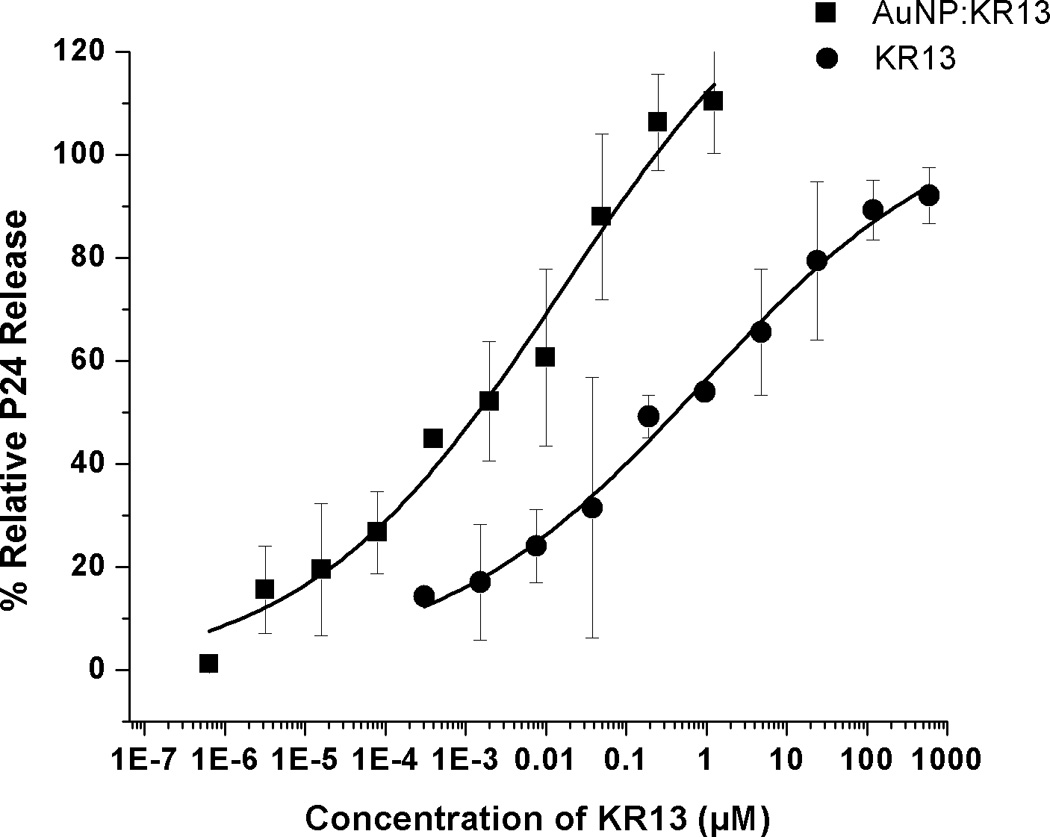
Figure 3.


Gag p24 release from HIV1BaL pseudotype virus caused by KR13 and AuNP-KR13. (A) and (B): Western blot gel images showing p24 release as a function of dose of KR13 alone (A) and AuNP-KR13 (B). Controls shown are lysed virus (treated with 1% Triton X-100) intact virus (no treatments) and p24 control (5 µL of 20 µg/ml). The highest concentration of KR13 in both cases is indicated, with subsequent lanes corresponding to sequential 1:5 fold dilutions indicated by arrows. C) Dose response plots of band intensities of the relative release percentage of p24 compared to the lysed virus control for both KR13 alone (circles) and AuNP-KR13 (squares).
