
Figure 2.
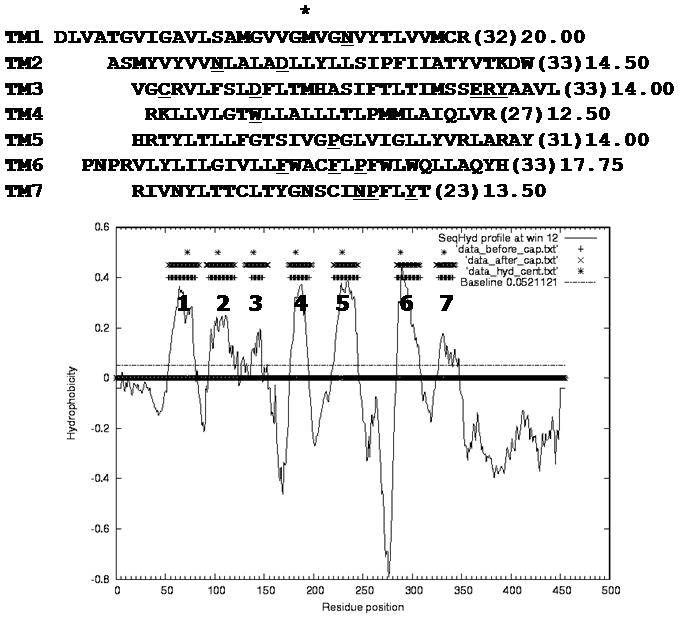
(Top) The predicted seven transmembrane (TM) regions and (Bottom) the hydropathy prediction from TMPred2nd for rat Urotensin II receptor. Hydrophobic centers marked with asterisks were calculated by the peak method. Highly conserved residues in each TM are underlined.