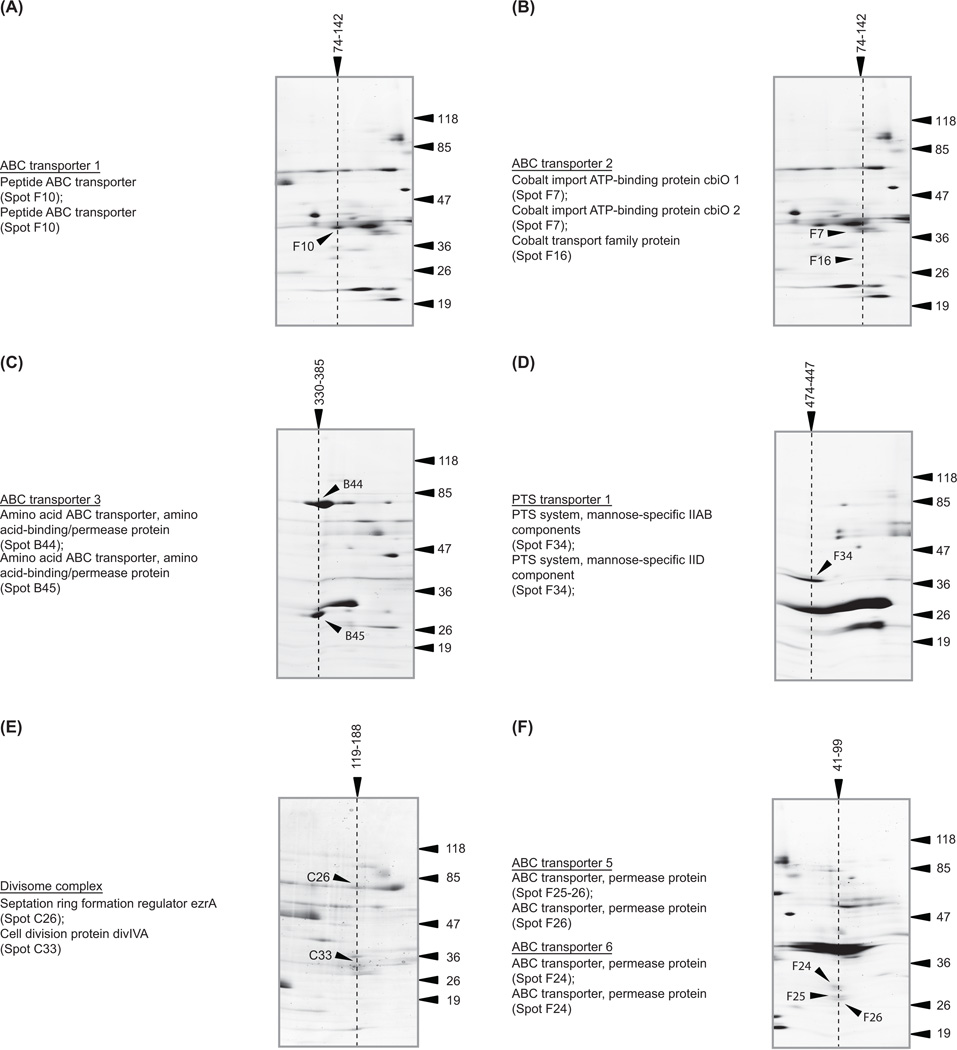
Figure 2. Examples of membrane protein complexes that were identified.
Cropped sections from the BN-/SDS-PAGE showing ‘vertical channels’ that contain proteins in known complexes. Only spots in a precise vertical channel can be part of the same complex. For the sake of clarity we have omitted annotations for proteins that are in close (but unrelated) channels. These spots were identified and are shown in Supplementary Figure 1. Soluble and membrane proteins were used to calibrate the protein complexes in the BN-PAGE (Supplementary Materials and Methods). As these two independent sets of proteins give significantly different calibration curves, we have calculated the molecular mass for each protein complex using both curves and reported a molecular mass range. All molecular mass markers are in kDa.

