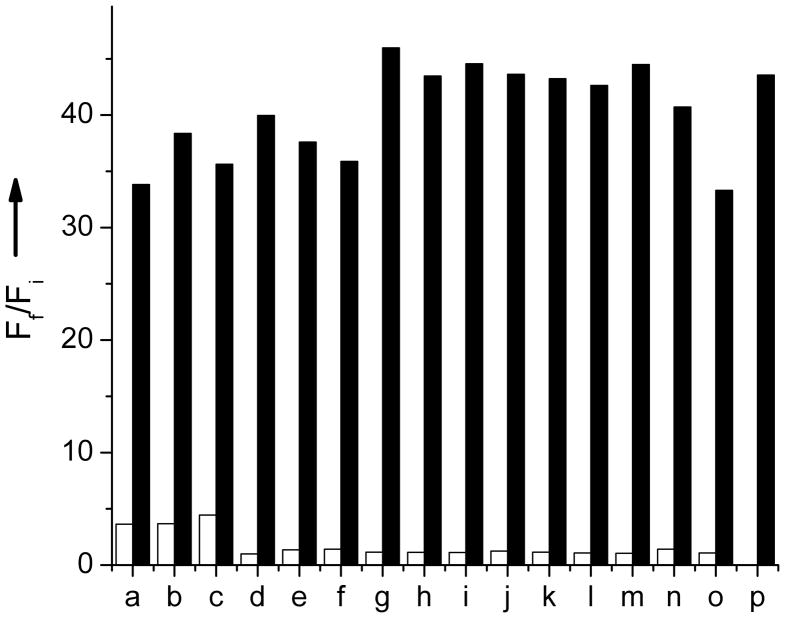
Figure 3.
Spectra acquired in 2.5% MeOH and water and NEt4OH (2:1 NEt4OH:LG). Fluorescence response of 5 μM LG to common biologically available cations. The bars represent the final fluorescence response (Ff) over the initial fluorescence response (Fi). White bars represent the addition of each ion (2 mM for Li+, Na+, K+, Ca2+, and Mg2+ and 75 μM for Fe2+, Co2+, Ni2+, Cu2+, Zn2+, Cd2+, Mn2+, Hg2+, As3+, Sn2+, and Pb2+. Black bars represent the addition of 75 μM Pb2+ to the solution. Excitation was provided at 389 nm. a. Li+, b. Na+, c. K+, d. Ca2+, e. Mg2+, f. Fe2+, g. Co2+, h. Ni2+, i. Cu2+, j. Zn2+, k. Cd2+, l. Mn2+, m. Hg2+, n. As3+, o. Sn2+, p. Pb2+.

