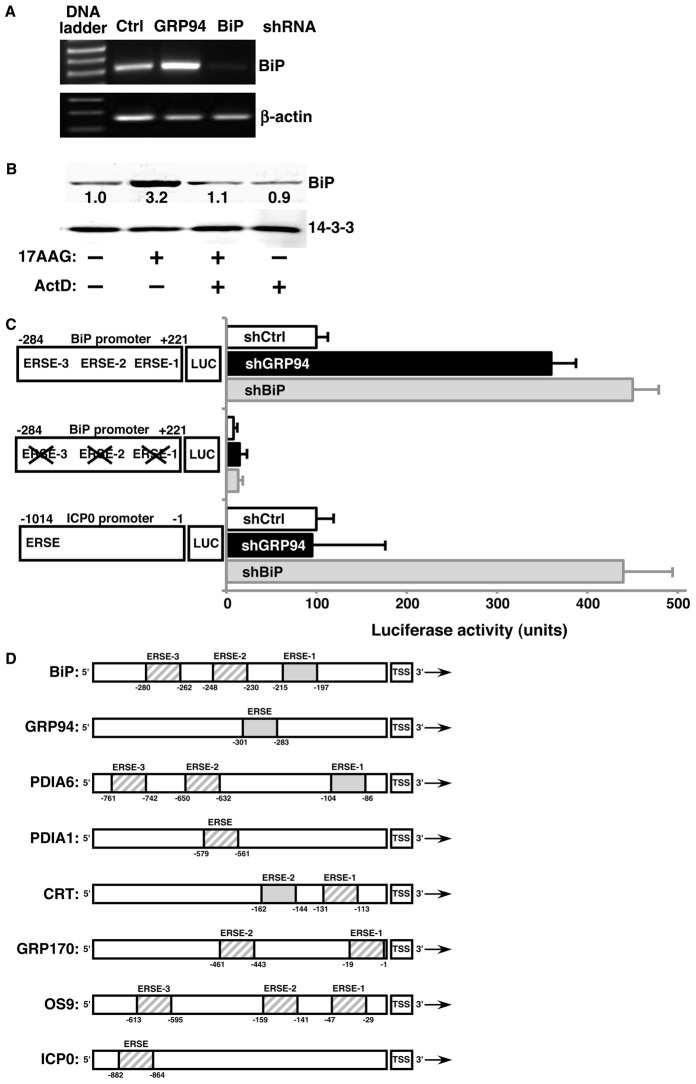
Fig. 3.
The GRP94-specific response is transcriptional. (A) Total RNA derived from 293T cells stably expressing shRNAs against GRP94, BiP or an irrelevant shRNA (Ctrl) was subjected to RT-PCR. Amplicons of BiP and β-actin were then resolved on agarose gels. The gel shown is representative of two independent experiments. (B) 10T1/2 cells were treated with either 5 µM 17AAG, 0.5 µg/ml actinomycin D (ActD) or both. After 24 hours, cells were lysed and the indicated proteins resolved and quantified by immunoblotting. (C) 293T cells in which an irrelevant gene (white bars, shCtrl), GRP94 (black bars), or BiP (gray bars) were silenced, were transiently transfected with reporter plasmids carrying luciferase driven by: the minimal promoter of BiP; a mutant version of the BiP promoter where the ERSEs were disrupted; or the minimal promoter of HSV ICP0, a UPR-responsive viral gene. All cells were also co-transfected with a plasmid carrying Renilla luciferase. Luciferase activity was assayed 24 hours post-transfection and relative luciferase activity was calculated as a percentage after normalization against Renilla values. Results are mean±s.e.m.; n = 6 transfections for the wild-type and mutant BiP promoters; n = 2 for the ICP0 promoter. Left: schematic representation of intact or mutated promoter-luciferase constructs. Numbers indicate the nucleotide position from the transcription start site. (D) Schematic representation of the promoters of select murine UPR targets, as well as HSV ICP0 genes. The ERSEs in each promoter, are as defined previously (Yoshida et al., 1998), and are shown as by shaded boxes. The solid gray boxes are identical in sequence, as shown in supplementary material Fig. S6. The numbers below the ERSEs define the bp position relative to the transcription start site (TSS).

