Fig. 5.

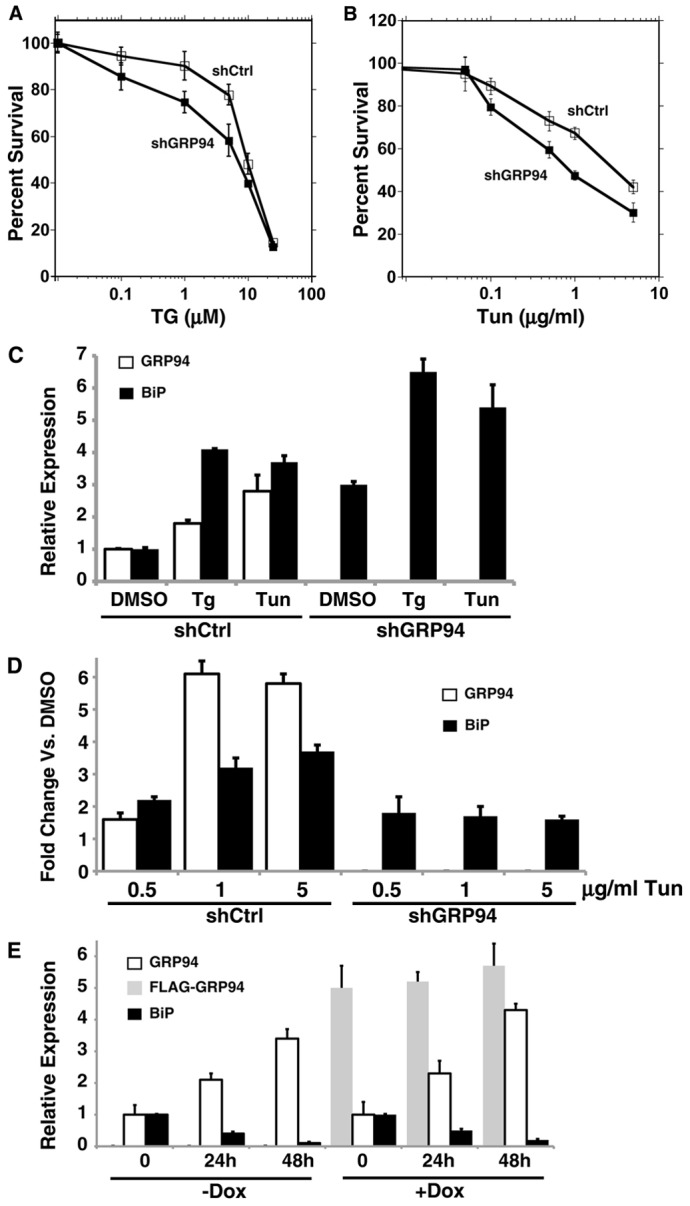
The responsiveness to ER stress is not diminished by ablation of GRP94. (A,B) HeLa cells stably expressing shRNA against GRP94 (shGRP94, black squares) or shRNA-Ctrl (white squares) were exposed to various doses of thapsigargin (TG) (A) or tunicamycin (Tun) (B). After 48 hours, cell viability was assayed by XTT and plotted as percentage relative to DMSO control. Results are the average ± s.d. of three (TG) and two (Tun) independent experiments performed in quadruplicate. (C) 293T cells stably expressing shRNA-CTRL or against GRP94 were treated with 10 µM TG, 10 µg/ml Tun or vehicle control (DMSO) for 18 hours. The protein levels were quantified by densitometry of immunoblots probed with anti-KDEL antibody to detect BiP and GRP94. The levels of expression of GRP94 (white) and BiP (black) were normalized against the DMSO levels and plotted in the bar graph. Values are means+s.d. of three experiments. (D) BiP response to titration of Tun doses. GRP94-silenced or control 293T cells were treated with Tun at the indicated concentrations for 18 hours. Cell lysates were analyzed as in C. The response values were renormalized to the response seen in each of cells without Tun, to separate the response to Tun from the inherent upregulation of BiP upon GRP94 KD. Note that BiP induction at the lower drug concentration is similar in the two cell lines, whereas they differ at higher concentrations of Tun. White bars, fold changes of GRP94 expression versus no Tun. Black bars, fold changes of BiP expression versus no Tun. Values are means+s.d. of three experiments. (E) CHO-tet cells were induced with 50 ng/ml doxycycline to express a Flag-tagged wild-type GRP94 cDNA. After 2 days, doxycycline or untreated cells were exposed to 10 ng/ml subAB to trigger ER stress. At the indicated time points after subAB addition, protein extracts were collected and analyzed as in A. White, level of GPR94; black, BiP; gray, FLAG–GRP94. Dox, doxycycline. The means±s.d. of four independent experiments are shown.
