
Fig. 1.
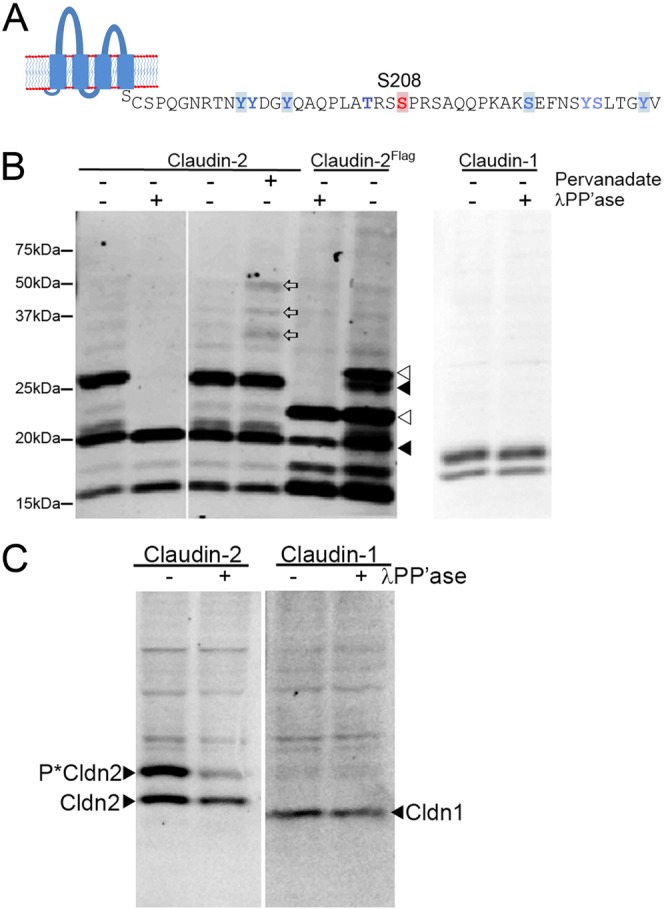
Identification of phosphorylation sites in claudin-2. (A) Use of the Net-Phos algorithm identified the highlighted amino acid residues as potentially modified by phosphorylation; thes and additional sites were confirmed by MS (blue residues). MS additionally identified several other sites, including Y195, T205, Y224 and S225; S208 is indicated in red. (B,C) Phos-tag SDS PAGE reveals that claudin-2 is multiply phosphorylated in MDCK II cells and in mouse kidney. (B, Left panel) Immunoblot of claudin-2 after Phos-tag SDS PAGE shows presence of multiple bands retarded by the Phos-tag-ligand, including a major band that migrates just above the 25 kDa mw marker (1st lane on left). Treatment of lysate with λ phosphatase reduces most of these bands to the size of unphosphorylated claudin-2, ∼20 kDa (2nd lane from left). Treatment of cells for 15 min with 1 mM pervanadate results in the appearance of several new immunoreactive bands (land 4, open arrows) compared with untreated cells (lane 3). N-terminally flag-tagged claudin-2 with (lane 5) and without (lane 6) λ phosphatase treatment shows the same pattern of phosphorylated bands, although they are shifted higher compared (open arrowheads) with the signal from endogenous claudin-2 (closed arrowheads). (B, right panel) Immunoblot of claudin-1 in the same samples reveals no evidence for constitutive phosphorylation; lower band is a proteolysis product. (C, left panel) Claudin-2 immunoblot of Phos-tag SDS PAGE of mouse kidney cell lysate reveals a similar major phosphorylated band as that seen in MDCK II cells; treatment of lysate with λ phosphatase results in decreased signal from this higher MW species; unphosphorylated claudin-2 migrates below the major phosphorylated species. (C, right panel) No constitutive phosphorylation of claudin-1 is seen in the same samples. Upper bands in both blots are non-specific signal from secondary antibody.