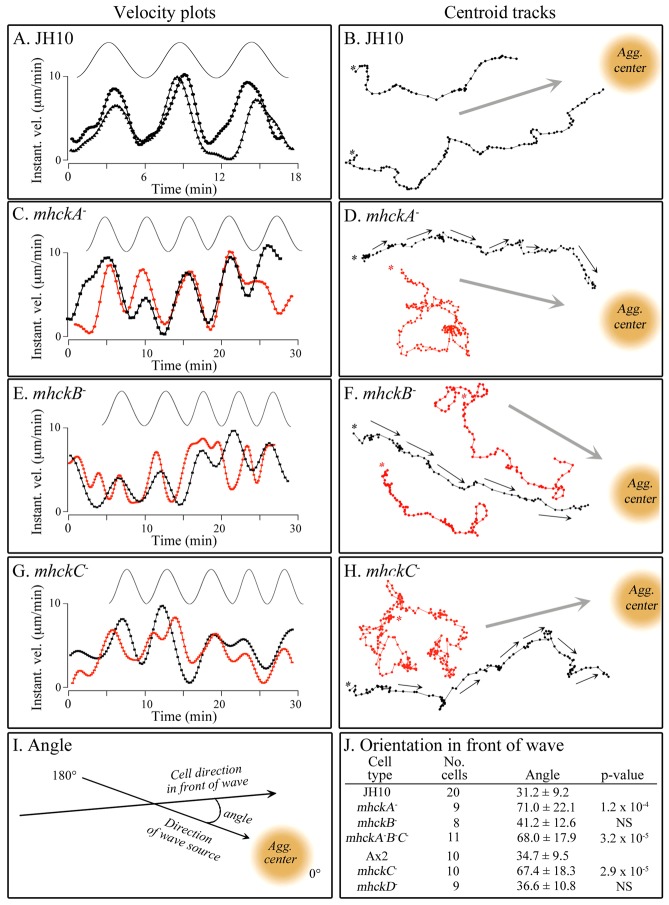
Fig. 5.
The mutants mhckA−,mhckC−, and mhckA−B−C− have lost the capacity to reorient in the front of each natural wave, in the direction of the aggregation center, the source of the waves. Parental and mutant cells were mixed at a ratio of 9∶1 and allowed to aggregate. (A,C,E,G) Representative velocity plots of cells responding to the temporal dynamics of successive natural waves (drawn above each velocity plot) for parent strain JH10 and mutants mhckA−, mhckB− and mhckC−, respectively (mhckD− and mhckA−B−C− not shown). In A, the data are for two representative JH10 cells in a homogeneous JH10 population (both black plots), and in C, E and G, the data are for a JH10 (black) and mutant (red) cell. (B,D,F,H) Representative centroid tracks at 20 sec. intervals in successive natural waves. In B, the data are for two representative JH10 cells (black). In D, F and H, data are for a representative control cell (black) and representative mutant (red) cells in 9∶1 mixtures. (I) Method for assessing the angle in the front of a wave. (J) Measured average angle in the front of successive waves.

