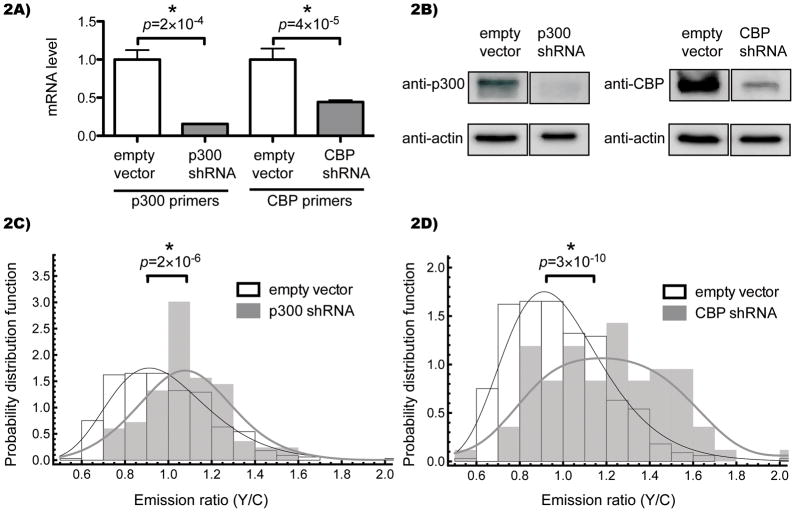
Figure 2.
Genetic knockdown of p300/CBP induces a FRET increase. A) Cos7 cells stably expressing shRNAs against p300 (NM_001429.x-8437s1c1) or CBP (NM_004380.1-3884s1c1) were harvested, transcriptome cDNA synthesized, and levels of p300 or CBP analyzed by real-time PCR compared to GAPDH control. The averages and standard errors of four technical replicates are shown. B) Whole cell lysates were analyzed by SDS-PAGE followed by immuno blotting against p300, CBP, or β-actin. Images were cropped to show the relevant bands side-by-side. C,D) Cells were transfected with Histac and images captured after 24 hours. Each nucleus was quantified for average pixel intensity (with background from an untransfected region subtracted) in each channel, and the emission ratio of YFP to CFP was calculated for each nucleus. 83 nuclei for p300 knockdown, 84 nuclei for CBP knockdown, and 333 nuclei for empty vector control were analyzed and shown as a histogram of the probability distribution function versus FRET ratio. The empty vector control is shown as open boxes, and knockdowns are shown as grey boxes, with black and grey curves indicating a log-normal fit and a smoothed empirical distribution for empty vector and knockdowns, respectively. The difference in the median FRET ratio was statistically significant when comparing the empty vector to p300 (p = 2×10⁻⁶) and CBP (p = 3×10⁻¹⁰).

