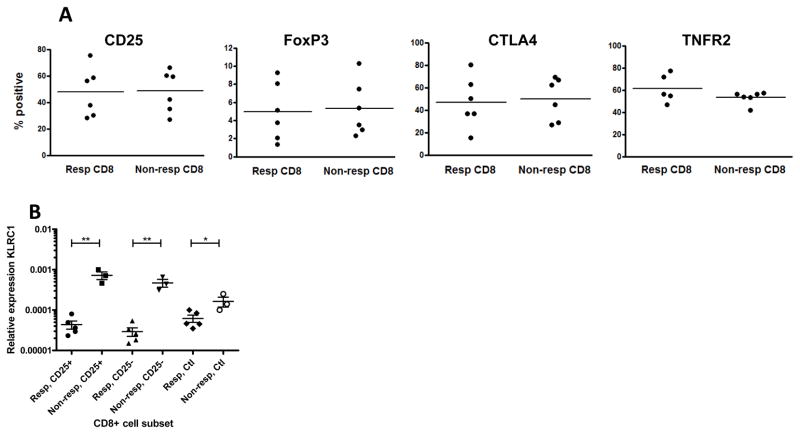
Figure 3. FACS and qPCR analysis of CD8+ Tregs.
(A) Expression of markers previously associated with Tregs on gated CD8+ T cells from responders (Resp, n=6) and non-responders (Non-resp, n=6) by flow cytometry after 5 day culture with Teplizumab. (B) Expression of NKG2A of both isoforms on CD8+ cells measured by RT-PCRfrom responders (n=5) and non-responders (n=3) to Teplizumab. RNA was extracted from sorted subpopulations of CD8+25+, CD25+25− T cells after activation with anti-CD3, or following culture with control IgG. The expression of both long and short isoforms were significantly different among the cell populations (*p<0.05, **p<0.01).

