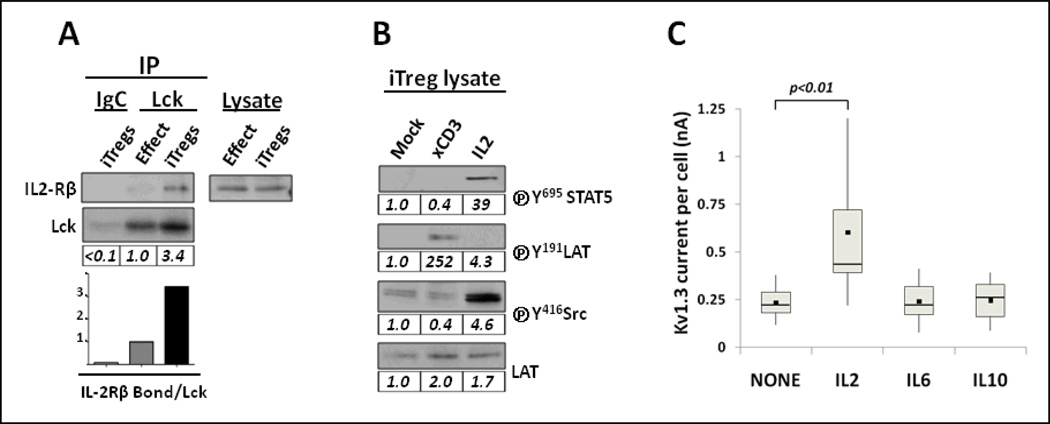
Figure 3. Lck and Kv1.3 respond to IL2 in iTregs.
(A). Physical association between Lck and IL2-R complex in iTregs. Lysates from 107 effector T cells and iTregs were incubated with Lck antibody-loaded agarose beads or Ig-isotype control (IgC). Cell extracts and immunoprecipitates were analyzed by SDS-PAGE and Western blots using CD122 (IL2-Rβ) and Lck antibodies. The results show that Lck co-immunoprecipitates with IL2-Rβ subunit in iTregs but not in effector cells. Lck blot verified equivalent yield of immunoprecipitate. Blotting total cell lysates with anti-CD122 demonstrated equal expression of IL2-Rβ in both cell types. Quantification of co-immunoprecipitates was determined by the relative ratio of IL2-Rβ bound to Lck and normalized at 1.0 in effector cells. (B). Functional association of Lck and IL2-R complex in iTregs. Sorted iTregs were rested for 6–7 hours on ice and mock-activated, anti-CD3 crosslinked or IL2 treated. Lysates of 5×10⁵ cells were subjected to immunoblotting using the indicated antibodies. Phosphorylation of STAT5 and Lck were detected upon IL2 treatment; phosphorylation of LAT demonstrated an effective response to CD3 crosslink. LAT expression verified equal loading. Quantification of protein expression was normalized on the basis of mock-treated iTregs for each individual blot. (C). IL2 treatment supports Kv1.3 current in iTregs. Sorted iTregs were cultured for 60 h in AIMV with or without 5 ng/mL of IL2, IL6 or IL10. Depiction, measurement of Kv1.3 currents and statistical analysis were performed as described in Fig. 2. The results demonstrate that iTregs cultured with IL2 displayed the largest Kv1.3 currents compared to IL6 and IL10. Profiles of Kv1.3 currents represent the combined values of two independent experiments.

