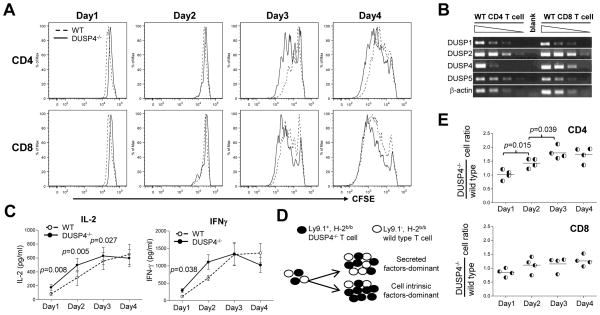
Figure 4.
DUSP4 deficiency induces CD4 T cells hyperproliferative by enhancing IL-2 signaling. (A) Purified total T cells as in Fig. 3A were loaded with CFSE and stimulated with 0.5, 1.6 or 5 μg/ml plate-bound anti-CD3 and anti-CD28. At each day cells were stained for CD4, CD8, CD25, 7AAD and AnnexinV, followed by analysis of CFSE histogram on gated live CD4+CD25+ (top row) or CD8+CD25+ (bottom row) T cells. See Supporting Information S3 for gating logics. (B) DUSP RT-PCRs were performed as in Fig. 1E with cDNA from MACS-sorted WT CD4 or CD8 T cells. Shown are RT-PCR results from 4-fold serial dilutions of cDNA. Control β-actin RT-PCR is also shown. Blank, no cDNA. (C) Culture supernatant from Fig. 4A was harvested daily and frozen at −80°C for simultaneous IL-2 (n=7, left panel) and IFN-γ (n=6, right panel) ELISA on all samples. (D) Schematic of the mixed T-cell proliferation assay. (E) Purified WT and DUSP4−/− T cells as in Fig. 3A were mixed at 1:1 ratio and stimulated in the same well with 0.5 or 1.6 μg/ml plate-bound anti-CD3 and anti-CD28, followed daily by staining with Ly9.1, CD4, and CD8. The ratios of Ly9.1+ DUSP4−/− T cells divided by Ly9.1− WT T cells are shown for CD4-gated (top) or CD8-gated (bottom) T cells (n=4). Representative results from two (panel B and E) or three (panel A and C) independent experiments are shown. p > 0.05 for all panels unless specified.

