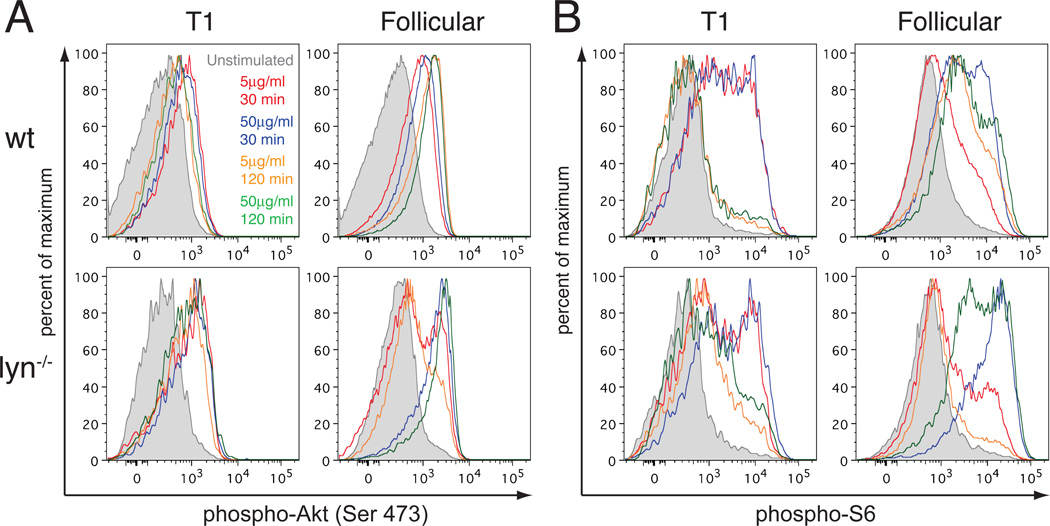
Figure 6. Effects of Lyn-deficiency on Akt signaling by T1 and follicular B cell subsets.
Levels of phospho-S473 Akt (A) and of phospho-S6 (B) were determined in T1 and follicular B cells from wild type (upper panels) and Lyn−/− (lower panels) mice. Shown are levels of signaling-related phosphorylations for unstimulated B cells, B cells stimulated with 5 µg/ml anti-IgM for 30min (red curves) or 120min (orange curves) or with 50µg/ml anti-IgM for 30min (blue curves) or 120 min (green curves). Results are representative of 2–3 mice per genotype analyzed on 2 different occasions.

