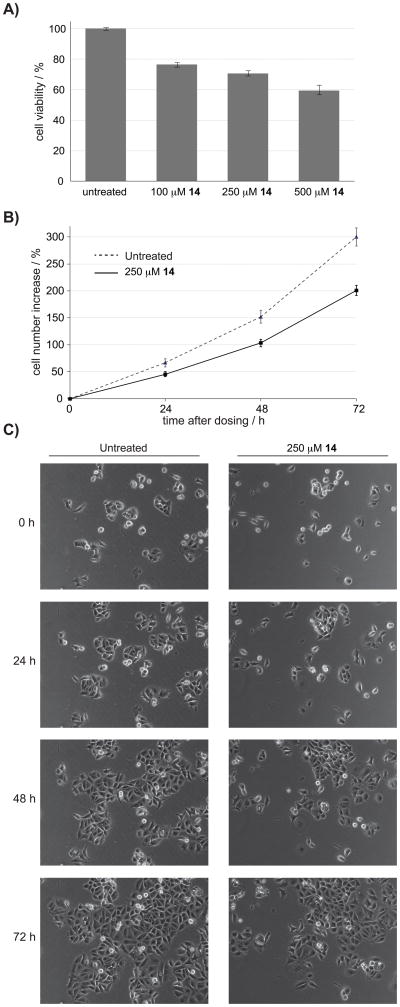
Figure 4.
Assessing the proliferation of MCF-7 cells treated with 14. A) MTS assays show a dose-dependent reduction in viable cells 48 hours after treatment. B) Analysis of cell growth by live cell imaging C) Representative images from live cell imaging showing a population of untreated cells over 72 hours, compared to a population of cells treated with 14. The videos shows the reduction in proliferation in cells treated with 14 is due to reduced rate of division rather than increased cell death.

