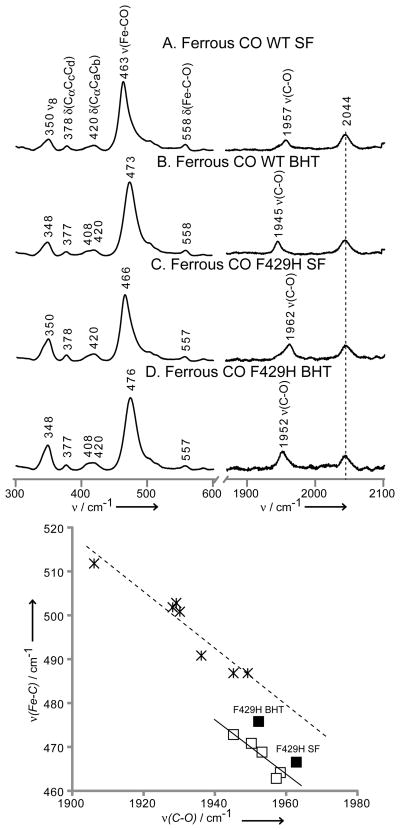
Figure 3.
The low (left) and high (right) frequency rR spectra of ferrous CO adducts of CYP2B4, wild-type substrate-free (A), wild-type BHT-bound (B), F429H mutant substrate-free (C) and F429H mutant BHT-bound (D). Spectra measured with 442 nm excitation line and normalized to the ν7 and ν4 modes for low and high frequency region, respectively. The bottom graph shows linear correlation between ν(Fe-C) and ν(C-O) frequencies, the open squares represent wild type truncated CYP2B4,[40] the solid squares indicate points for F429H mutants and the stars show mammalian NOSs.[37–39]

