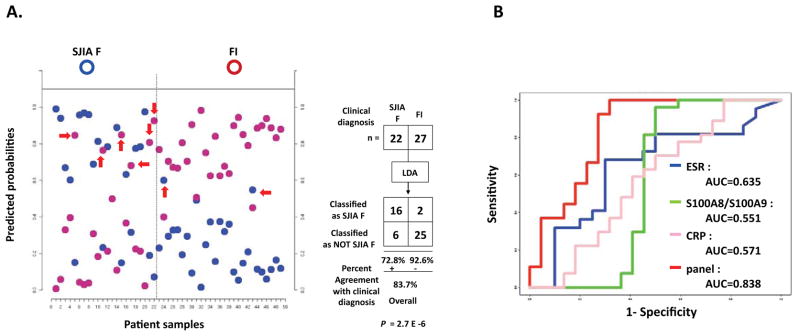
Figure 5.
Linear discriminant analysis of the 7-protein SJIA flare biomarker panel, differentiating SJIA F from FI subjects. (A) LDA analysis. SJIA F (n=22) and FI (n=27) subjects were used to develop a binary-class classifier. Samples are partitioned by the true class (upper) and predicted class (lower). The maximum estimated probability for each of the wrongly assigned samples is marked with a red arrow. The LDA classification results are shown as a 2×2 contingency table. Fisher exact test was used to measure the statistical significance (P value) of the 2×2 table. B. ROC analyses. The effectiveness of the biomarker panel to discriminate SJIA F from FI was compared to either S100A8/S100A9, CRP or ESR respectively.

