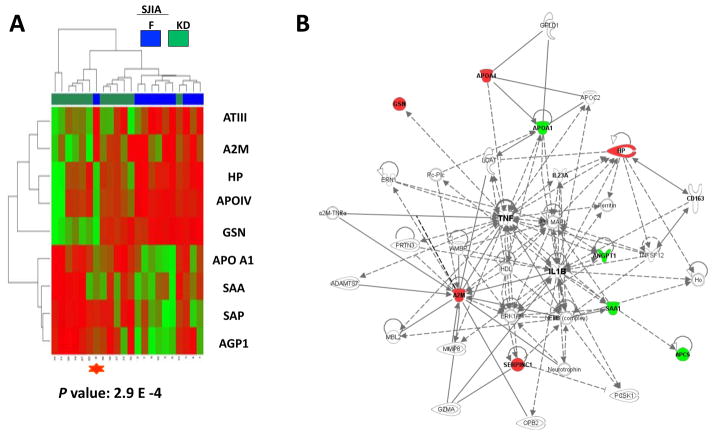
Figure 8.
Analysis of the protein profiles differentiating SJIA F from KD subjects. A. Heatmap display of unsupervised clustering analyses of expression of the top 9 proteins with Student’s t test P value < 0.05 comparing SJIA F and KD samples. The mis-clustered SJIA F sample (shown in Figure 1 labeled with a red star) by the SJIA F panel when comparing SJIA F to either SJIA Q or FI is also mis-clustered when comparing SJIA F and KD (labeled with a red star). B. Data mining software (Ingenuity Systems, www.ingenuity.com, CA) was used with differentially (SJIA F vs KD) expressed plasma proteins to identify gene ontology groups and relevant canonical signaling pathways associated with SJIA flare. The intensity of the node color indicates the degree of up- (red) or down- (green) regulation in SJIA F. Nodes are displayed using shapes that represent the functional class of the gene product and different relationships are represented by line type (see key). Relationships are primarily due to co-expression, but can also include phosphorylation/dephosphorylation, proteolysis, activation/deactivation, transcription, binding, inhibition, biochemical modification.

