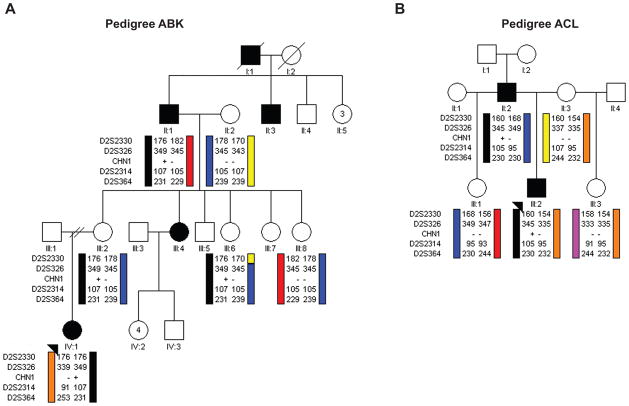
Figure 1. Schematic pedigrees and haplotype analysis of families segregating autosomal dominant DRS at the CHN1 locus.
Pedigree members are denoted by circles (females) and squares (males) and by their generation and position. Black circles/squares indicate clinically affected individuals, and black arrowheads denote the probands. Haplotype analysis of (A) pedigree ABK and (B) pedigree ACL are shown schematically for markers surrounding the CHN1 gene. Genotyping data and schematic segregating haplotype bars for four chromosome 2 markers and CHN1 mutation status are shown below the symbol for each individual who participated in the study. Black bars indicate the affected haplotype that was passed from the affected grandfather in pedigree ABK or the affected father in pedigree ACL. For CHN1, (+) indicates presence of the mutation while (−) indicates its absence. For Pedigree ABK, the affected haplotype and CHN1 mutation are also inherited by two unaffected family members, III:2 and III:6.

