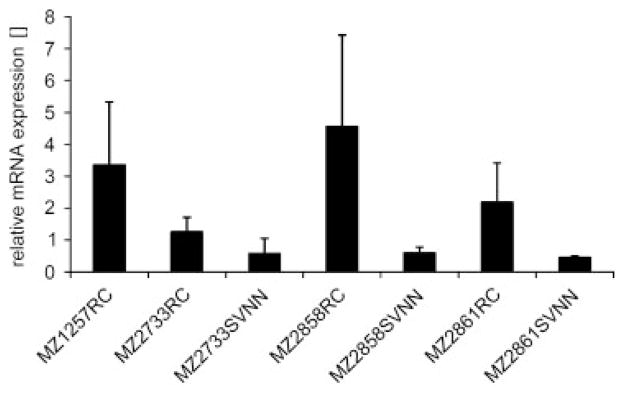
Figure 2.
Representative qPCR-based expression analyses for sulfoxiredoxin 1 (SRXN1) in paired RCC and corresponding tumor adjacent renal epithelium representing cell lines. q-PCR analyses of three paired RCC (MZ2733RC, MZ2858RC and MZ2861RC) and corresponding SV40TL transformed tumor adjacent renal epithelium representing cell lines (MZ2733SVNN, MZ2858SVNN and MZ2861SVNN) along with the RCC cell line MZ1257RC, here serving as positive control, were performed as described in Section 2. The graph represents means and standard deviations of at least two independent biological replicates.

