
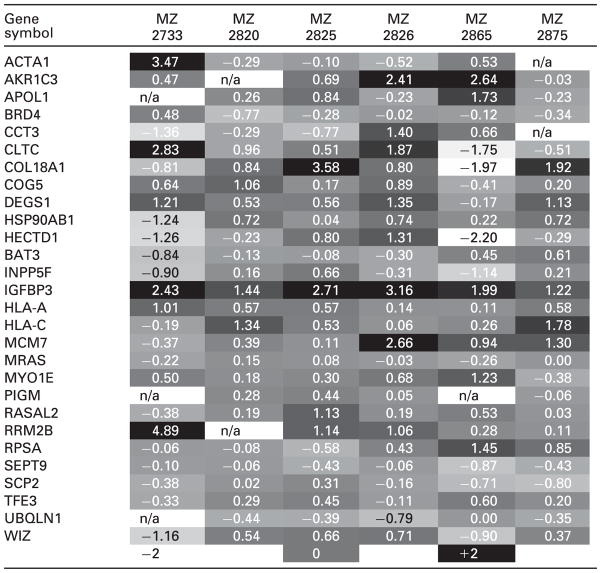
Table 2.
Overlap of targets shared between the ligandomics and microarray analyses
|
The table lists the gene symbols along with the log fold changes defined in a subset of six previously analyzed tissue systems comprising renal cancer versus tumor adjacent normal renal epithelium [44]. The bottom line defines the coding of the regulation mode. Data that were not interpretable are marked by n/a.