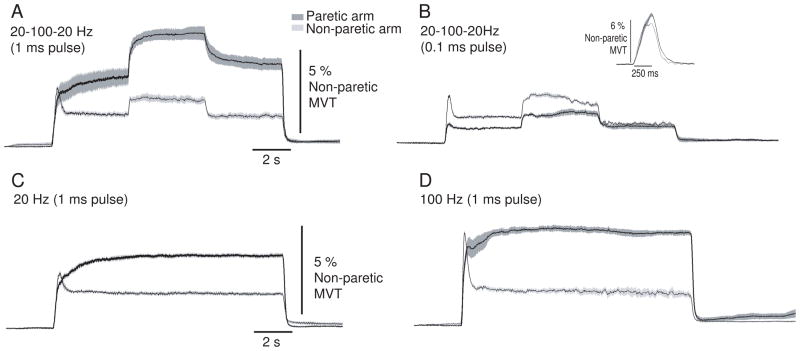
Figure 2.
Torque generated by each stimulation pattern in a single participant. Torque in the paretic arm is shown by the dark trace and in the non-paretic arm by the light trace. Each panel shows the torque generated by a specific stimulation pattern: A) 20-100-20 Hz (1 ms pulse width); B) 20-100-20 Hz (0.1 ms pulse width); C) 20 Hz constant frequency (1 ms pulse width); and D) 100 Hz constant frequency (1 ms pulse width). The inset in panel B shows the torque evoked in each arm by the short stimulus train (25 pulses at 100 Hz; 1 ms pulse width) used to set stimulus intensity. Each trace is an average of 5 repetitions of each stimulation pattern. The shaded bands represent ± 2 SE. The shaded regions in Panel A represent the time periods (Time 1 and Time 2) over which data were quantified for statistical analyses (see Figures 4 and 5).

