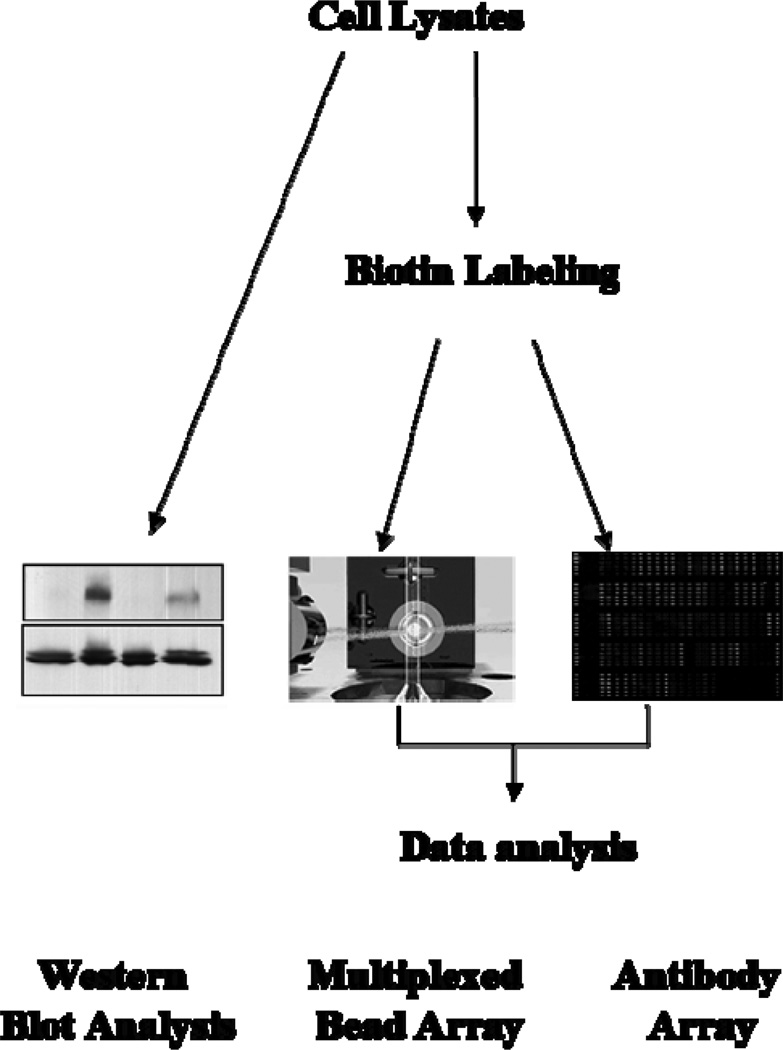
Figure 2.
Schematic overview of the experimental design and procedure. Two sets of experiments were carried out in different time periods, and each set of experiments contained 4 independent replicates. Each independent replicate included one cell culture dish (60 mm in diameter) serving as the control, one for insulin treatment, one for PMA treatment, and one for treatment with PMA followed by insulin stimulation (4 samples per one replicate). After treatment with PMA and insulin, HepG2 cells were lysed in the extraction buffer described in the “Materials and methods” section. Four out of 8 dish lystaes were analyzed by western blot, and the others were labeled with biotin and analyzed with either the antibody array or the multiplexed bead array.

