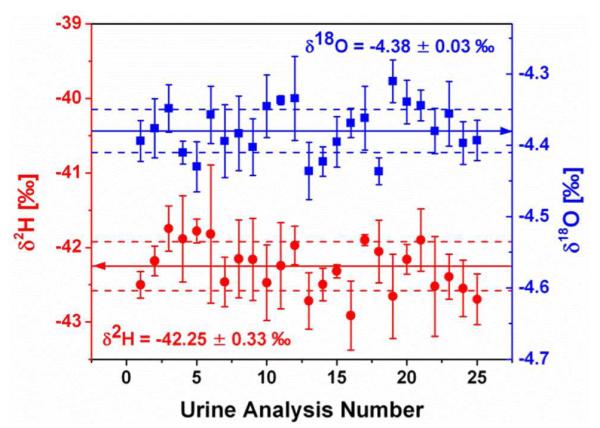
Figure 3.

Precision of OA-ICOS for urine analysis demonstrated by making 25 repeated analyses from a single vial of a 750 μl natural urine sample. Error bars indicate the standard deviation of the four averaged injections that make up a single analysis. The δ2H (left axis, red circles) average (solid line) is −42.25 ± 0.33 ‰ (1σ, dashed lines) and the δ18O (right axis, blue squares) average (solid line) is −4.38 ± 0.03 ‰ (1σ, dashed lines).
