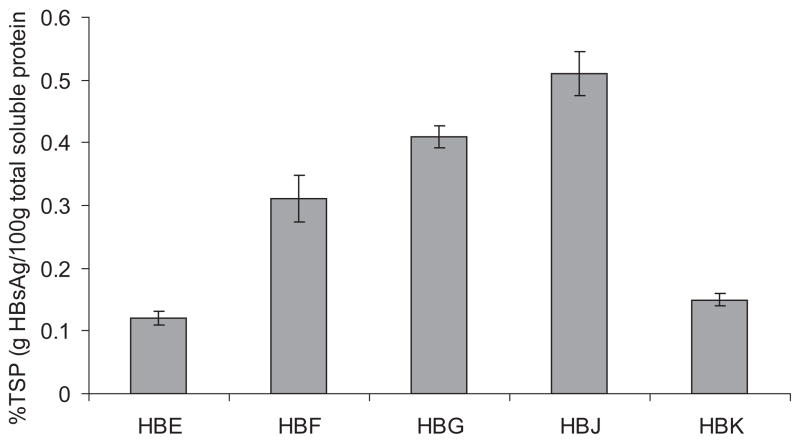
Figure 2.
HBsAg accumulation in single seeds from the first generation (T1) after transformation, as determined by ELISA. Means of the top 10% of seeds were calculated for ears derived from putative single locus insertion events. Error bars represent standard error. Number of seeds included in the mean: n = 22, 24, 33, 24, and 23 for constructs HBE, HBF, HBG, HBJ, and HBK, respectively.

