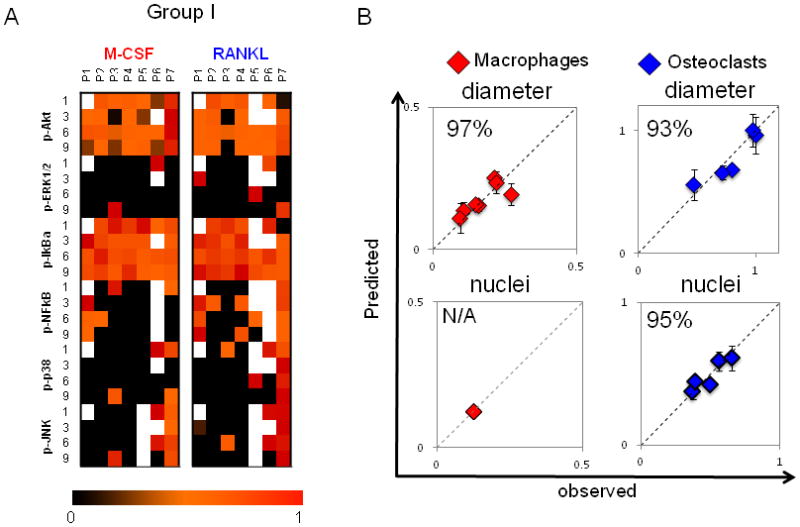
Figure 3. Patient-to-patient variability in macrophage and osteoclast differentiation outcomes of cell diameter and number of nuclei is captured in kinase activation state of differentiating monocytes.

A) On days 1, 3, 6 and 9 of differentiation, macrophages and osteoclasts were lysed, and kinase signals were quantified using Bioplex technology. A compendium of time-dependent kinase signals of patients 1–7 (group I) is shown. Signals are normalized to the highest value within a given time point and a kinase. White boxes correspond to missing measurements. B) A PLSR model was generated with kinase signals of differentiating macrophages as inputs and cell diameter as an output (R2Y = 0.734 Q2= 0.061, 1 significant PC). A separate PLSR model was generated for differentiating osteoclasts with their kinase signals in input matrix and their cell size and number of nuclei in output matrix (R2Y = 0.815, Q2 = 0.248, 2 significant PCs). Prediction was made with cross-validation and jack-knifing approaches, and predictability was calculated based on RMSEE. Plots of predicted vs. observed are shown, with blue diamonds for osteoclasts and red diamonds for macrophages. Predictability for cell diameter was 96% for macrophages and 89% for osteoclasts. Predictability for number of nuclei was 94% for osteoclasts. With only one nucleus, no variation can be predicted for macrophage.
