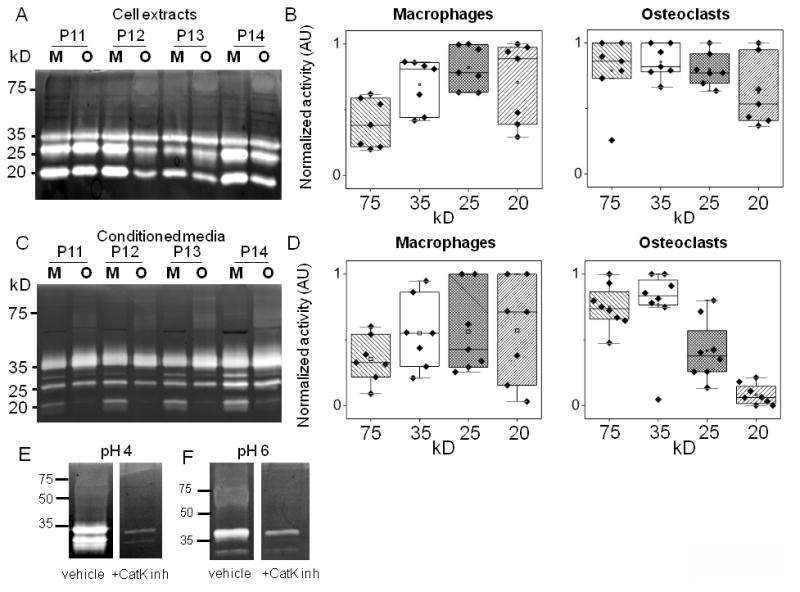
Figure 5. Cathepsin proteolytic profiles of differentiated macrophages and osteoclasts reflect patient-to-patient variability.

Multiplex cathepsin zymography (assay buffer, pH 4) and quantification of (A, B) cell extracts or (C, D) conditioned media for macrophage and osteoclast differentiation from patient monocytes. Quantification of cathepsin activity and patient variability is represented in the box and whisker plots. To confirm identity of 75kD band as cathepsin K, osteoclast lysates were loaded for zymography and 1μM of cathepsin K inhibitor (1-(N-benzyloxycarbonyl-leucyl)-5-(N-Boc-phenylalanyl- leucyl) carbohydrazide [Z-L-NHNHCONHNH-LF-Boc] was incubated with the zymogram during the overnight incubation at pH 4 (E) or pH 6 (F). The 75kD active band no longer appears.
