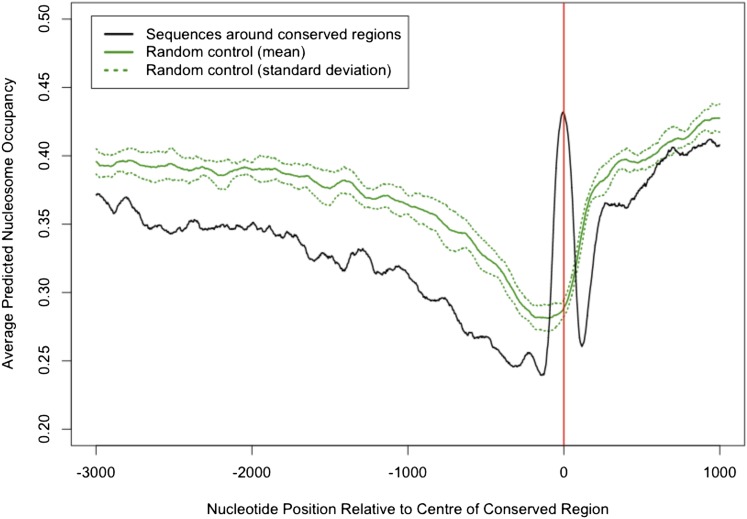
Figure 3.
Predictions of Nucleosome Occupancy Confirm Significance of CNSs Identified.
Average predicted nucleosome occupancy for 554 10-kb sequences surrounding CNSs (black line) and 10 equivalent sets of control sequences (solid green line represents mean of the 10 control sequence sets; dashed line shows sd) was calculated. The −3 kb to +1 kb regions are plotted for clarity, as values plateau either side of this for the remainder of the −5 kb to +5 kb range examined. Red line at nucleotide position 0 indicates the center position of CNS or control sequences, with TSS therefore being positioned to the right of this.

