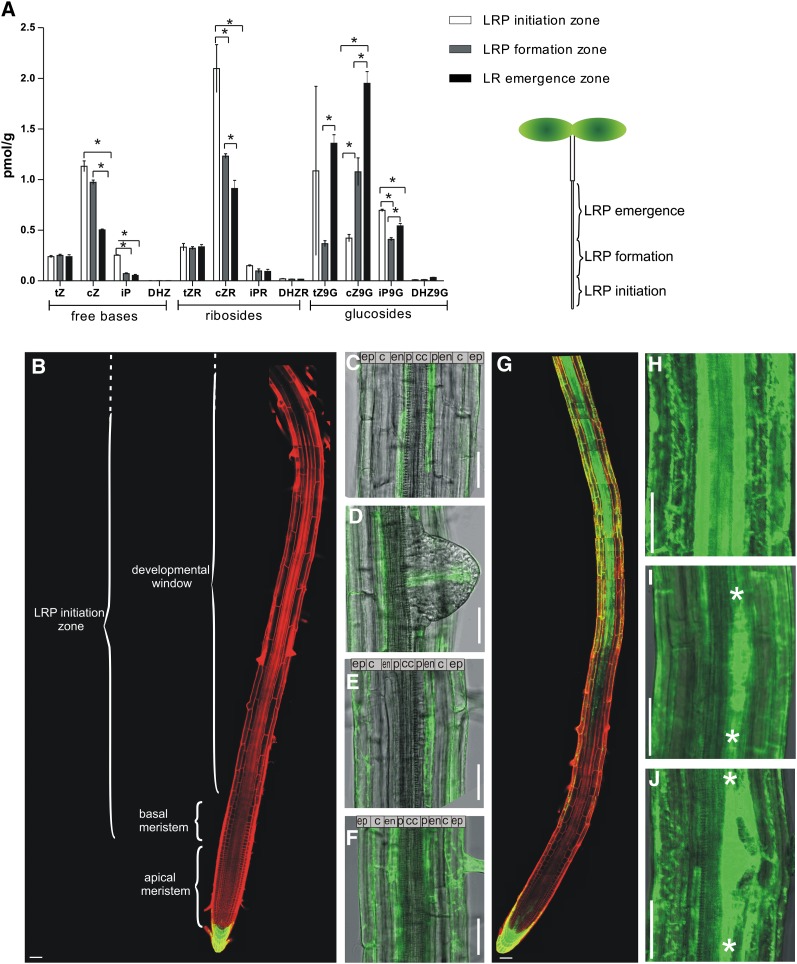
Figure 1.
Distribution of Cytokinin and Cytokinin Response in Roots.
(A) Quantification of cytokinin levels in the zones of LRP initiation zone, formation, and emergence. Error bars denote se (*P < 0.05; Student’s t test; n = 3).
(B) to (F) TCS:GFP expression in 8-d-old untreated roots detected in the root cap, but not in the root meristem, basal meristem, and developmental window (B); in the individual xylem pole pericycle cells between developing young primordia (C); in the provasculature tissue in emerging LRPs (D); in the endodermal cells adjacent to early-stage LRPs (E); and continuously in the endodermis of the emerging primordium zone (F).
(G) to (J) TCS:GFP expression in 8-d-old roots treated for 16 h with 10 μM benzyl adenine induced in the provasculature of the root, but not basal, meristem (G) and in all tissues of the differentiation zone ([G] and [H]), including primordia at all developmental stages ([I] and [J]).
Plasma membranes were visualized by propidium iodide staining. c, cortex; cc, central cylinder; cZ, cis-zeatin; cZ9G, cis-zeatin-9-glucoside; cZR, cis-zeatin riboside; DHZ, dihydrozeatin; DHZ9G, dihydrozeatin-9-glucoside; DHZR, dihydrozeatin riboside; en, endodermis; ep, epidermis; iP, isopentenyladenine; iP9G; isopentenyladenine-9-glucoside; iPR, isopentenyl adenosine; p, pericycle; tZ, trans-zeatin; tZ9G, trans-zeatin-9-glucoside; tZR, trans-zeatin riboside. White asterisks indicate borders of LRPs. Bars = 50 μm.

