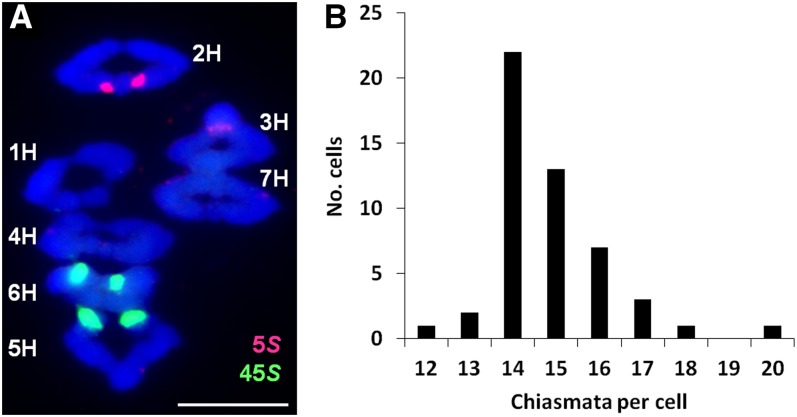
Figure 1.
Chiasma Frequency of Barley ‘Morex.’
(A) Individual bivalents stained with DAPI (blue) can be identified at meiotic metaphase I using the 5S (red) and 45S (green) ribosomal DNA probes with FISH. Chiasma number and position are determined by bivalent shape. Bar = 10 µM.
(B) Histogram of chiasmata per cell. The chiasma frequency has a narrow range overdistributed around the mean (14.84 ± 0.19).

