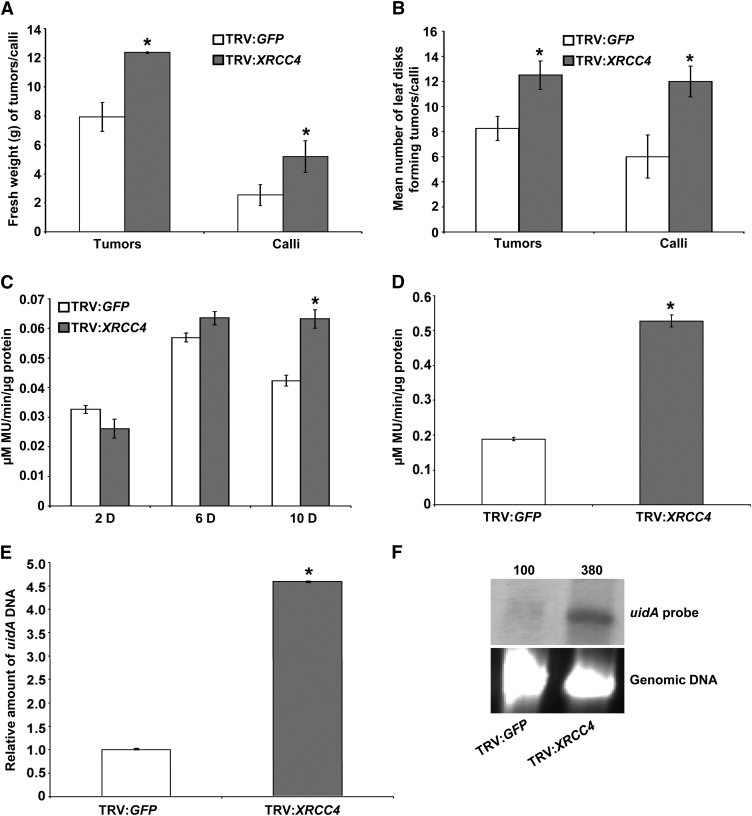
Figure 1.
VIGS of XRCC4 Suggests Its Negative Role in Stable Transformation and T-DNA Integration.
(A) Fresh weight quantification of TRV:GFP (control) and TRV:Nb-XRCC4–silenced leaf disks challenged with low concentration (1 × 10⁷ cfu/mL) of Agrobacterium A348 for tumor assay or Agrobacterium GV2260 harboring pCAS1 for stable transformation assay to generate PPT-resistant calli.
(B) Quantification of the average number of leaf disks forming tumors or calli from the samples in (A) per 15 leaf disks. In (A) and (B), data are presented as mean ± sd (n = 10) from 10 replicates with 15 leaf disks per treatment.
(C) Quantification of GUS activity by recording the fluorescence of 4-methylumbelliferone (MU) from TRV:GFP and TRV:Nb-XRCC4–silenced leaf disks infected with Agrobacterium GV2260 harboring pBISN1 at 2, 6, and 10 DAI.
(D) Quantification of GUS activity 3 weeks after infection of TRV:GFP and TRV:Nb-XRCC4–silenced leaf disks infected with Agrobacterium GV2260 harboring pKM1. In (C) and (D), data represent the average of three biological replicates with sd (n = 5) values shown as error bars.
(E) qPCR-mediated quantification of relative T-DNA integration in callus suspension cultures raised from TRV:GFP and TRV:Nb-XRCC4–silenced leaf disks challenged with Agrobacterium GV2260 harboring pBISN1.
(F) T-DNA integration assay in TRV:Nb-XRCC4–silenced and TRV:GFP-infected plants. Undigested genomic DNA isolated from 2-month-old culture was blotted on to a nylon membrane and subjected to hybridization with a DIG-labeled uidA gene probe (top panel). The intensity of uidA-specific signals in the top panel was quantified using a densitometer, and values were assigned relative to that of TRV:GFP control (100%). Ethidium bromide staining shows equal loading of genomic DNA (bottom panel).
Asterisks in (A) to (E) indicate a significant difference between TRV:GFP and TRV:Nb-XRCC4–silenced samples according to Student’s t test (P < 0.05; see Supplemental Figures 1 and 2 online).

