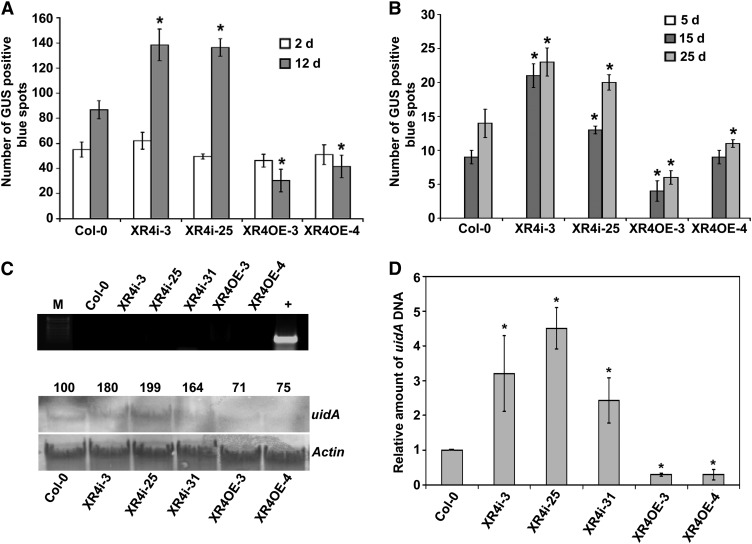
Figure 4.
Arabidopsis XRCC4 Expression Does Not Affect Transient Transformation but Affects T-DNA Integration.
(A) Root segments of Col-0, XRCC4 RNAi (XR4i), and XRCC4 overexpression lines (XR4OE) were inoculated with Agrobacterium GV3101 harboring pBISN1, and blue spots on roots were counted at 2 and 12 d after staining with X-gluc.
(B) Root segments of Col-0, XRCC4 RNAi, and overexpression lines were inoculated with Agrobacterium GV3101 harboring pKM1 for promoter trap assay. Root segments were stained with X-gluc, and blue spots were counted at 5, 15, and 25 DAI. In (A) and (B), data are presented as mean ± sd (n = 3) from three replicates with 50 root segments per treatment. Asterisks indicate a significant difference between Col-0 and XRCC4 RNAi or overexpression lines according to Student’s t test (P < 0.05).
(C) PCR to check contamination of Agrobacterium DNA in plant DNA samples used for DNA gel blot analysis (top panel). Quantification of T-DNA integration using uidA probe on DNA gel blot containing intact high molecular weight genomic DNA isolated from suspension cell cultures of Col-0, XRCC4 RNAi, and overexpression lines. Root segments from these samples were challenged with Agrobacterium GV3101 harboring pBISN1 and calli raised on nonselective media were subcultured to raise suspension cultures. Actin was used as a probe to show equal loading. Band intensities were quantified using a densitometer, and values were assigned relative to that of Col-0 (100%; bottom panel). M, DNA marker; +, positive control showing amplification of Atu0972 gene from Agrobacterium genomic DNA.
(D) DNA isolated from samples in (C) was subjected to a qPCR assay using uidA primers, and relative amounts of integrated T-DNA are shown compared with Col-0 control. The data represent the average of three biological replicates with sd values shown as error bars. Asterisks indicate a significant difference between Col-0 and XRCC4 RNAi or overexpression lines according to Student\x{2019}s t test (P < 0.05).

