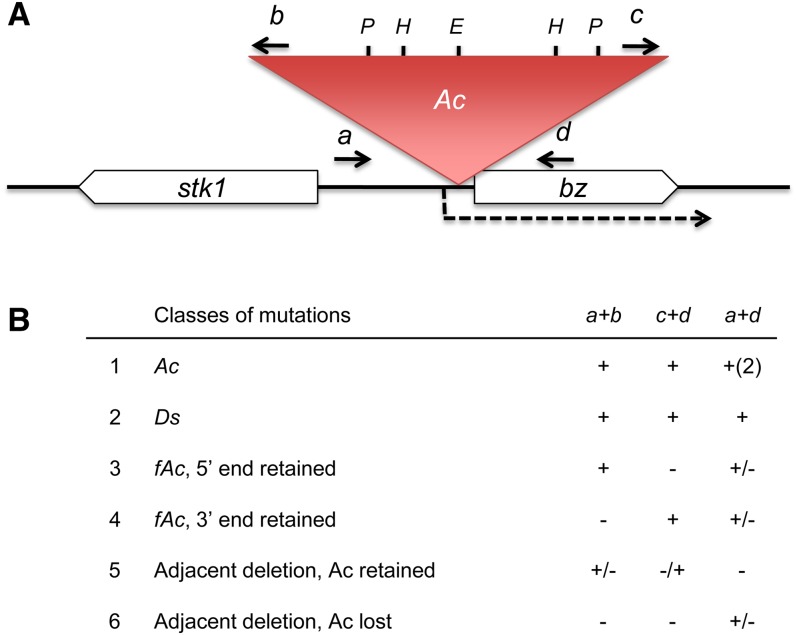
Figure 2.
PCR Characterization of bz Derivatives.
(A) Structure of bz-m39(Ac), showing Ac inserted in the 5′ UTR of the bz gene. The bz transcript is represented by the dotted arrow; Ac and bz are in the same transcriptional orientation. Primers and their approximate locations are indicated by short arrows. Primers a and d anneal to sequences adjacent to Ac39; primers b and c anneal to the Ac subterminal region. E, EcoRI restriction site; H, HindIII restriction site; P, PvuII restriction site.
(B) Summary of the PCR amplification patterns given by the various derivatives. The derivatives fell into six classes based on the PCR results. +, band present; −, band absent; +/−, band present in some derivatives, absent in others; +(2), two bands amplified.
[See online article for color version of this figure.]

