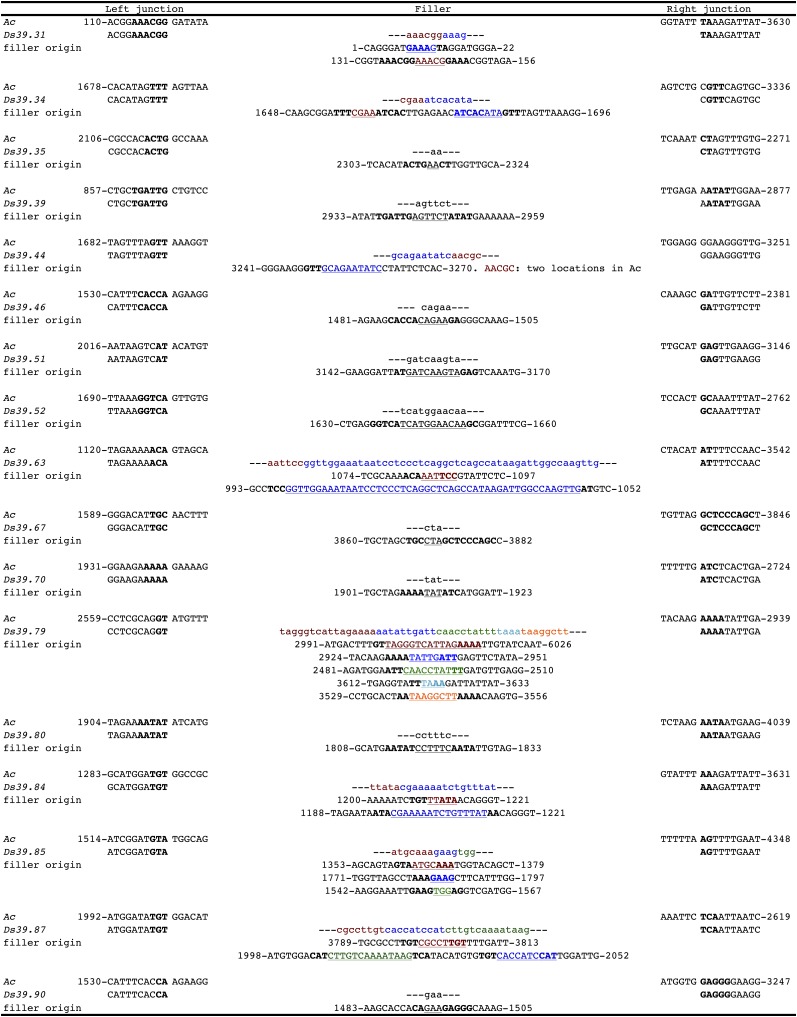
Figure 5.
Sequences of the Ds Filler Junctions.
Sequences of the left (5′) and right (3′) deletion junctions and the corresponding sequence in Ac are shown for each Ds element. Microhomology sequences are bolded. Filler DNA is shown in lowercase, and the Ac sequence from which it originated is shown in underlined uppercase. Numbers refer to coordinates in the Ac sequence (GenBank X05425). Colored filler sequences denote multiple origins in the Ac sequence, where they are represented in the same color.

