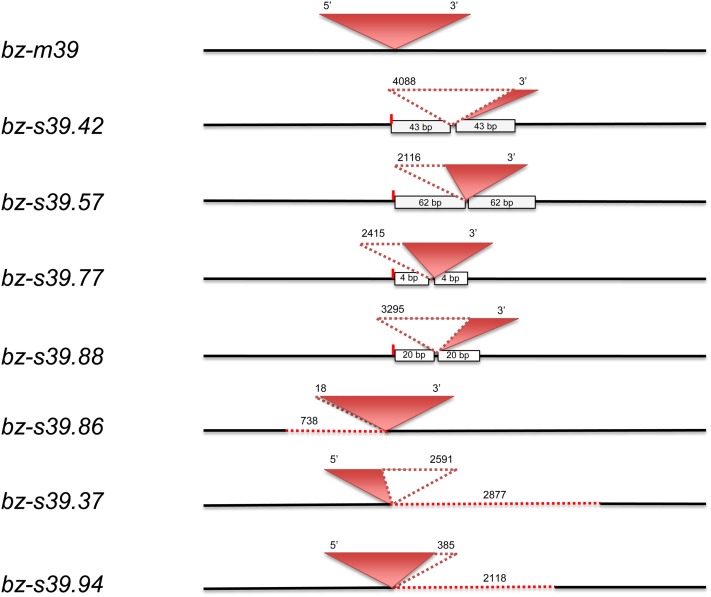
Figure 6.
Structure of fAcs.
Boxes represent duplicated bz sequences, dotted lines represent deletions, and their sizes (in bp) are shown above each rearrangement. Short vertical lines denote excision footprints at the original insertion site of Ac. All alleles are aligned at this site.
[See online article for color version of this figure.]

