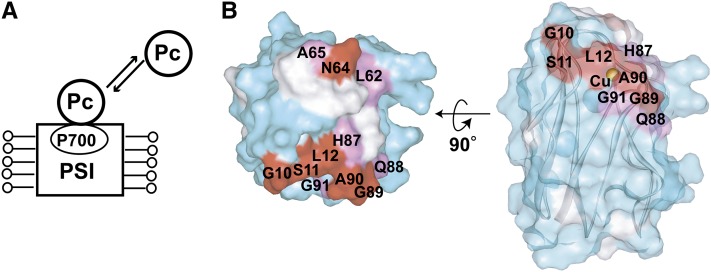
Figure 3.
Determination of the Interface Residues of Pc for Solubilized PSI.
(A) Schematic diagram of the TCS experiments with excess amounts of Pc relative to the solubilized PSI.
(B) Mapping of the residues affected by the irradiation in the TCS experiments. The plots of the reduction ratios are shown in Supplemental Figure 4A online. The labeling and coloring schemes are the same as in Figure 2.

