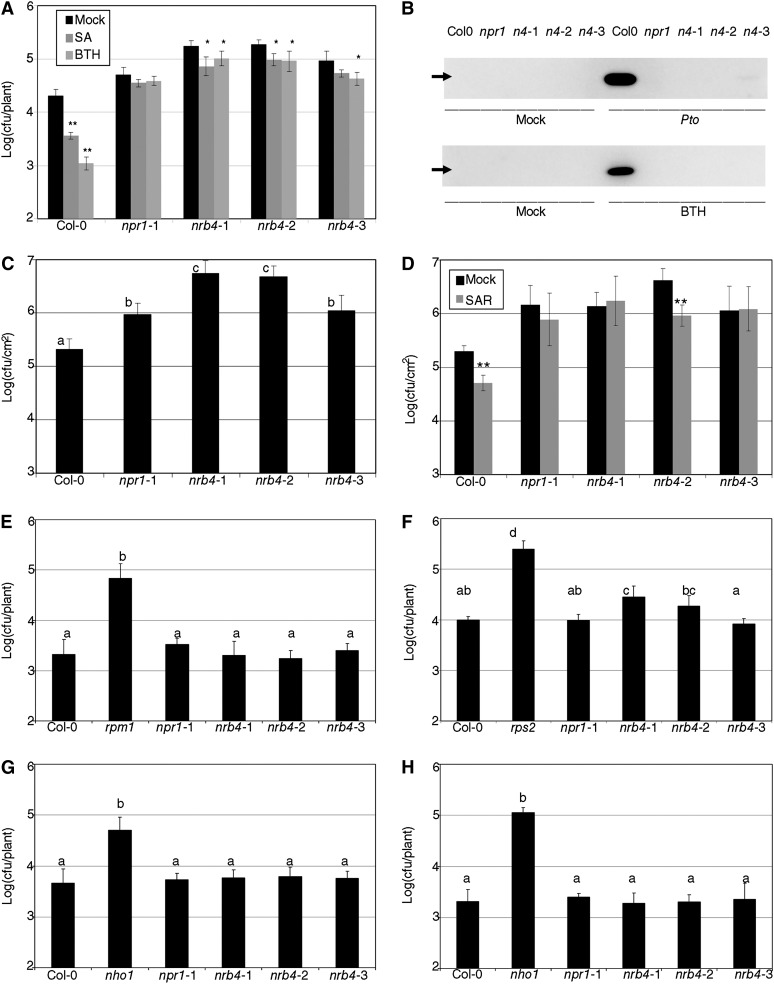
Figure 2.
Pathogenic Phenotypes of nrb4 Plants.
(A) Seventeen-day-old plants were treated with either 500 µM SA, 350 µM BTH, or a mock solution. One day later, the plants were inoculated with Pto at an OD600 of 0.1. Three days after inoculation, the growth of Pto was evaluated as logarithm of colony-forming units per plant.
(B) PR1 immunoblot of the indicated genotypes 3 d after mock or a Pto inoculation (top) and 1 d after mock or 350 µM BTH treatment (bottom). The genotypes are abbreviated as in (A). The arrow indicates the position of PR1 (14 kD).
(C) Plants (32 days old) were treated with Pto as in (A). In these plants, only a sample of the surface area was measured, so the units are log(cfu/cm2).
(D) Three leaves of 30-d-old plants were hand-infiltrated with either Pto(avrRpm1) or a mock solution. Two days later, Pto was inoculated and its growth in systemic leaves measured as in (C).
(E) Pto(avrRpm1) was inoculated in nrb4 as in (A). Resistance to Pseudomonas maculicola 1 (rpm1) is included as a control.
(F) Inoculations with Pto(avrRpt2), with rps2 added as a control.
(G) P. syringae pv phaseolicola isolate NPS3121 was inoculated as in (A), with nho1 used as a control.
(H) Inoculations with P. syringae pv tabaci was inoculated as in (A), with nho1 used as a control.
The experiments were repeated three times with similar results, and the data represent the average, with the error bars plotting the sd of 15 plants in three groups of five in (A) and (E) to (H). In (C) and (D), 12 samples of known size from three plants were taken in three groups of four. The letters above the bars indicate different homogeneous groups with statistically significant differences (Fisher’s LSD test, P < 0.05). Asterisks indicate statistically significant differences from the mock treatment (*P < 0.05; **P < 0.01) using the Student’s t test (one tail).

