Figure 7.
Expression of NRB4 and Subcellular Localization.
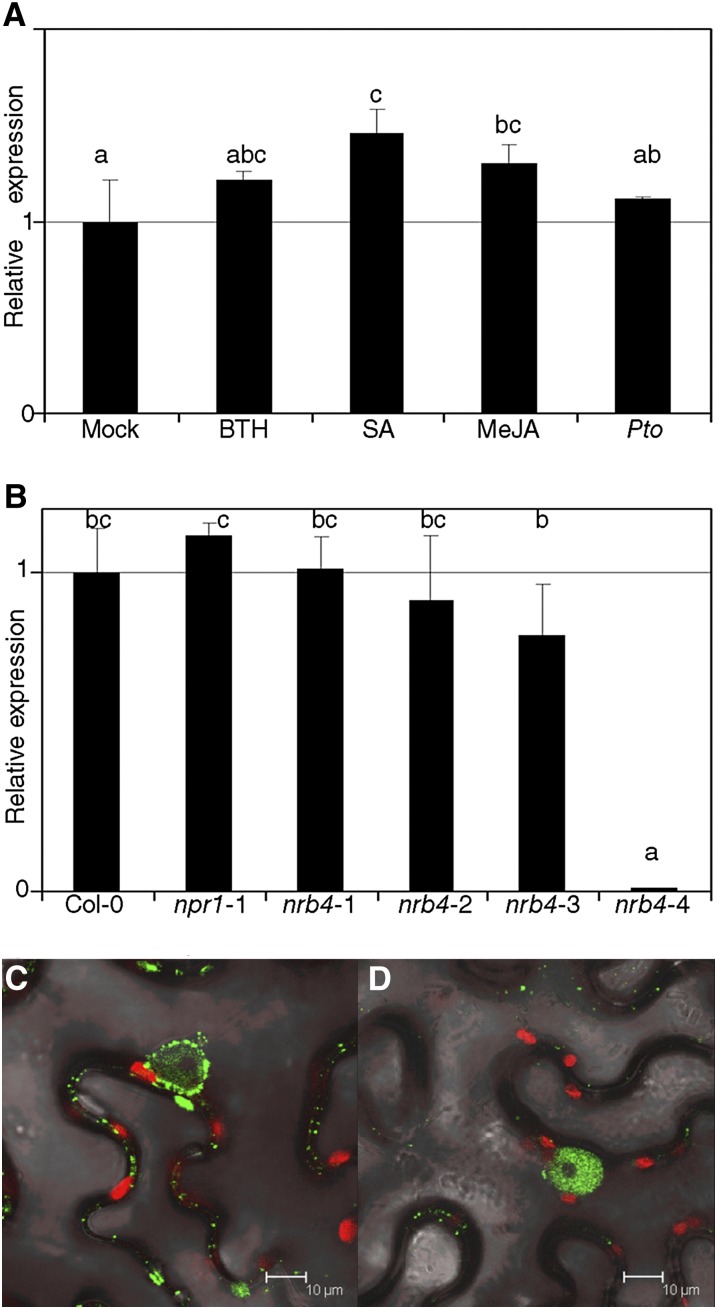
(A) NRB4 expression was measured 1 d after treatment with mock, 350 µM BTH, 500 µM SA, and 100 µM MeJA or 3 d after a Pto inoculation (RNA extracted and qRT-PCR from three independent samples of 100 mg each). The levels of expression are normalized to three reference genes and to the level of Col-0.
(B) RNA was extracted from 3-week-old plants (five weeks for nrb4-4), and transcript levels for NRB4 were measured by RT-qPCR as in (A).
(C) Agrobacterium tumefaciens with the construct 35S:NRB4-GFP was infiltrated into leaves of N. benthamiana, and the expression was detected by confocal microscopy 4 d later.
(D) Similar to (C) with the construct 35S:GFP-NRB4.
The experiments were repeated three times with similar results, and the data represent the average, with the error bars plotting the sd of three samples. The letters above the bars indicate different homogeneous groups with statistically significant differences (Fisher’s LSD test, P < 0.05).

