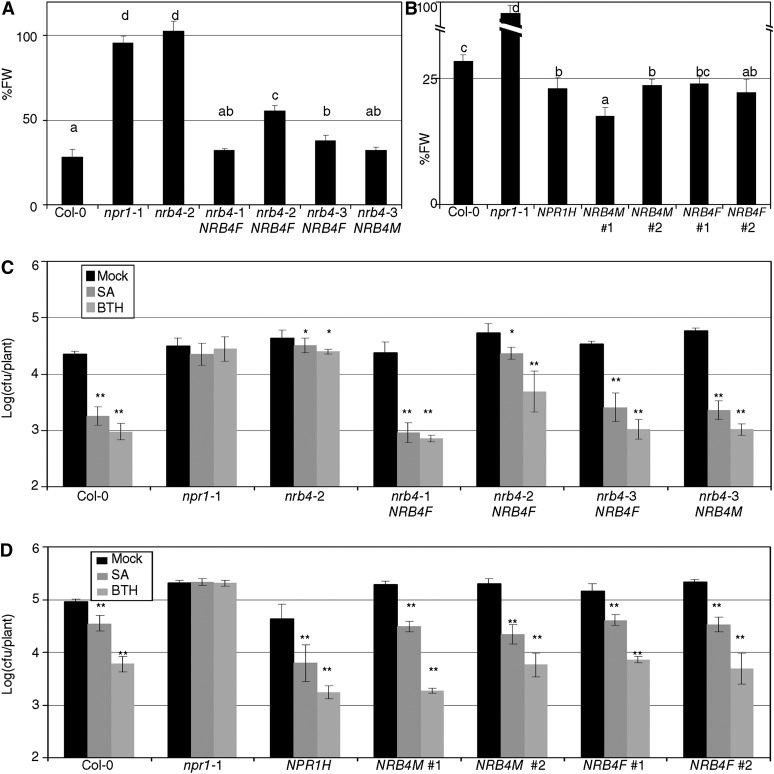
Figure 8.
Phenotypes of Transgenic Lines.
(A) Transgenic plants homozygous for the construct 35S:NRB4-GFP (NRB4F) or for the equivalent construct with only the first 670 amino acids (NRB4M) were obtained in the mutant alleles. The panel shows the response to BTH in fresh weight (FW) of the mentioned lines tested as in Figure 1A.
(B) The constructs described in (A) were transformed into Col-0, and their response to BTH in fresh weight recorded. The number indicates an independent line.
(C) Response of the transgenic lines described in (A) to SA and BTH in growth curves, as described in Figure 2A.
(D) Response of the transgenic lines described in (B) to SA and BTH in growth curves, as described in Figure 2A.
The experiments were repeated three times with similar results, and the data represent the average, with the error bars plotting the sd of 15 plants in three groups of five. The letters above the bars indicate different homogeneous groups with statistically significant differences (Fisher’s LSD test, P < 0.05). Asterisks indicate statistically significant differences from the mock treatment (*P < 0.05; **P < 0.01) using the Student’s t test (one tail).

