Figure 2.
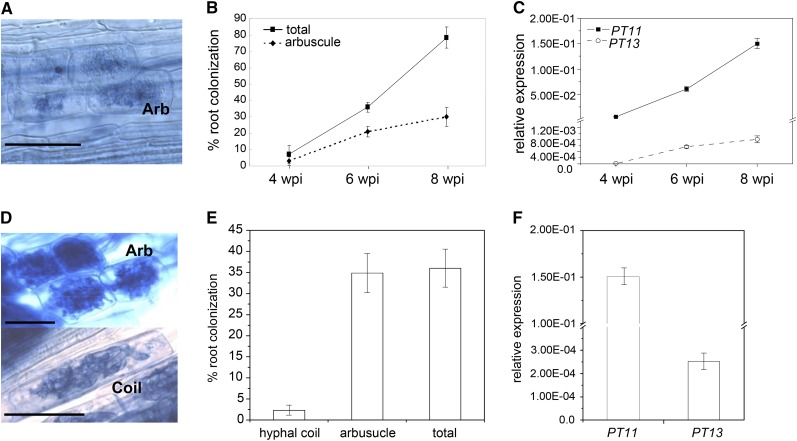
Expression Analysis of PT11 and PT13 in G. intraradices and G. rosea Colonized Rice Roots.
(A) Micrograph of G. intraradices arbuscules (Arb).
(B) Total (squares) and arbuscular (diamonds) colonization levels of wild-type roots with G. intraradices at 4, 6, and 8 wpi.
(C) Expression of PT11 (squares) and PT13 (circles) at 4, 6, and 8 wpi with G. intraradices.
(D) Micrograph of G. rosea arbuscules and coils. Bars = 50 μm.
(E) Colonization levels of wild-type rice at 10 wpi with G. rosea.
(F) Expression of PT11 and PT13 at 10 wpi with G. rosea. Gene expression levels are shown relative to the expression of the constitutive rice Cyclophilin 2 gene.
(B) and (E) Mean values of three biological replicates are shown, each consisting of two pooled plants.
(C) and (F) Error bars refer to the se of the mean of three technical repeats. The experiment was repeated twice with similar results.

