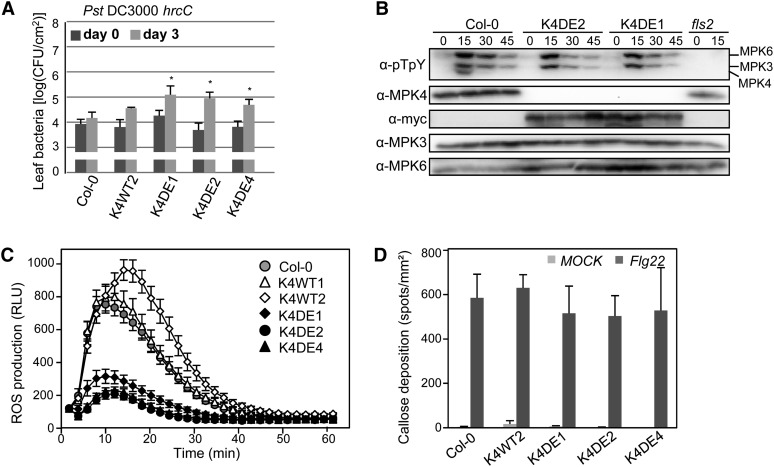
Figure 5.
Characterization of PTI Responses in CA-MPK4 Lines.
(A) Growth of Pst DC3000 hrcC on the indicated genotypes. Bacterial titers were determined 2 h (day 0, dark-gray bars) and 3 d (light-gray bars) after spray inoculation. Bars are average of four replicates, and error bars show sd. Results are representative of three independent experiments. *P < 0.05
(B) Flg22-induced activation of MAPKs in Col-0 and two CA-MPK4 lines at the indicated time points, using anti-pTEpY immunoblot.
(C) Oxidative burst response in wild-type and CA lines in response to 0.5 µM flg22. Results are means ± se (n > 20) of a representative experiment among four. P value < 10−7 at 11 min for all K4DE lines. RLU, relative light units.
(D) Callose production in 4- to 5-week-old plants of the indicated genotypes infiltrated with half-strength MS or half-strength MS supplemented with 300 nM flg22. Data are means ± se of four independent experiments except for K4DE4 line with two experiments (n > 10 leaves).

