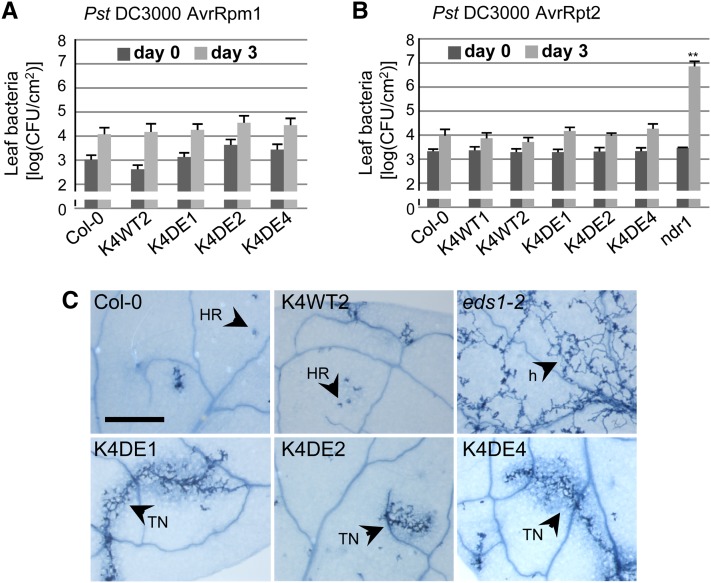
Figure 7.
ETI Responses in CA-MPK4 Lines.
(A) and (B) Growth of Pst DC3000 AvrRpm1 (A) and Pst DC3000 AvrRpt2 (B) in the indicated genotypes. Bacterial titers were determined 2 h (day 0, dark-gray bars) and 3 d (light-gray bars) post spray inoculation. Bars are average of at least four replicates, and error bars show sd. **P value < 0.01. Similar results were obtained in at least three independent experiments.
(C) Growth of H. arabidopsidis Emwa1 and cell death structures in leaves of the indicated genotypes. Leaves were stained with lactophenol trypan blue 6 d after inoculation. h, hyphae; HR, hypersensitive response; TN, trailing necrosis. Bar = 500 nm.
[See online article for color version of this figure.]

