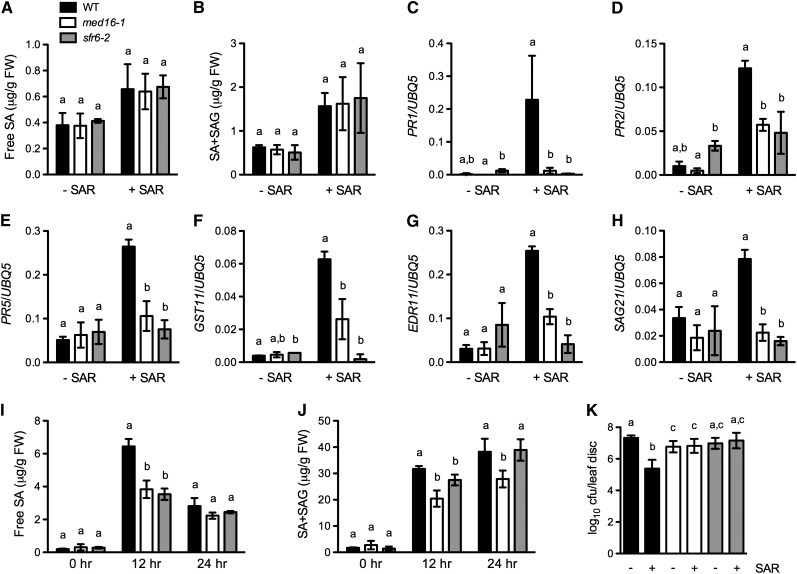
Figure 7.
SAR Induction in med16/sfr6 Mutants.
(A) and (B) Free SA (A) and total SA (B) levels in systemic leaves of med16/sfr6 and wild-type (WT) plants. Three lower leaves on each plant were inoculated with Psm ES4326 (OD600 = 0.002) (+SAR) or mock-treated with 10 mM of MgCl2 (−SAR). The upper uninfected/untreated systemic leaves were collected 48 h later for SA measurement. Data represent the mean of three independent samples with sd. FW, fresh weight; SAG, SA-2-O-β-d-glucoside.
(C) to (H) Expression of PR1, PR2, PR5, GST11, EDR11, and SAG21 in systemic leaves of med16/sfr6 and wild-type plants. Three lower leaves on each plant were inoculated with Psm ES4326 (OD600 = 0.002) (+SAR) or mock-treated with 10 mM of MgCl2 (−SAR). After 2 d, total RNA was extracted from the upper uninfected/untreated systemic leaves and analyzed for the expression of indicated genes using real-time qPCR. Expression was normalized against constitutively expressed UBQ5. Data represent the mean of three independent samples with sd.
(I) and (J) Free SA (I) and total SA (J) levels in challenge-inoculated systemic leaves of med16/sfr6 and wild-type plants. Three lower leaves on each plant were inoculated with Psm ES4326 (OD600 = 0.002). After 2 d, the upper uninfected systemic leaves were challenge-inoculated with Psm ES4326 (OD600 = 0.001). Leaf samples were collected at the indicated time points for SA measurement. Data represent the mean of three independent samples with sd.
(K) SAR-mediated resistance in med16/sfr6 and wild-type plants. Three lower leaves on each plant were inoculated with Psm ES4326 (OD600 = 0.002) (+SAR) or mock-treated with 10 mM of MgCl2 (−SAR). After 2 d, two upper uninfected/untreated leaves were challenge-inoculated with Psm ES4326 (OD600 = 0.001). The in planta bacterial titers were determined immediately and 3 d after challenge inoculation. Data represent the mean of eight independent samples with sd. Different letters above the bars indicate significant differences (P < 0.05, Student’s t test). The comparison was made separately among the wild type, med16-1, and sfr6-2 for each time point or treatment. All the experiments were repeated with similar results. cfu, colony-forming units.

