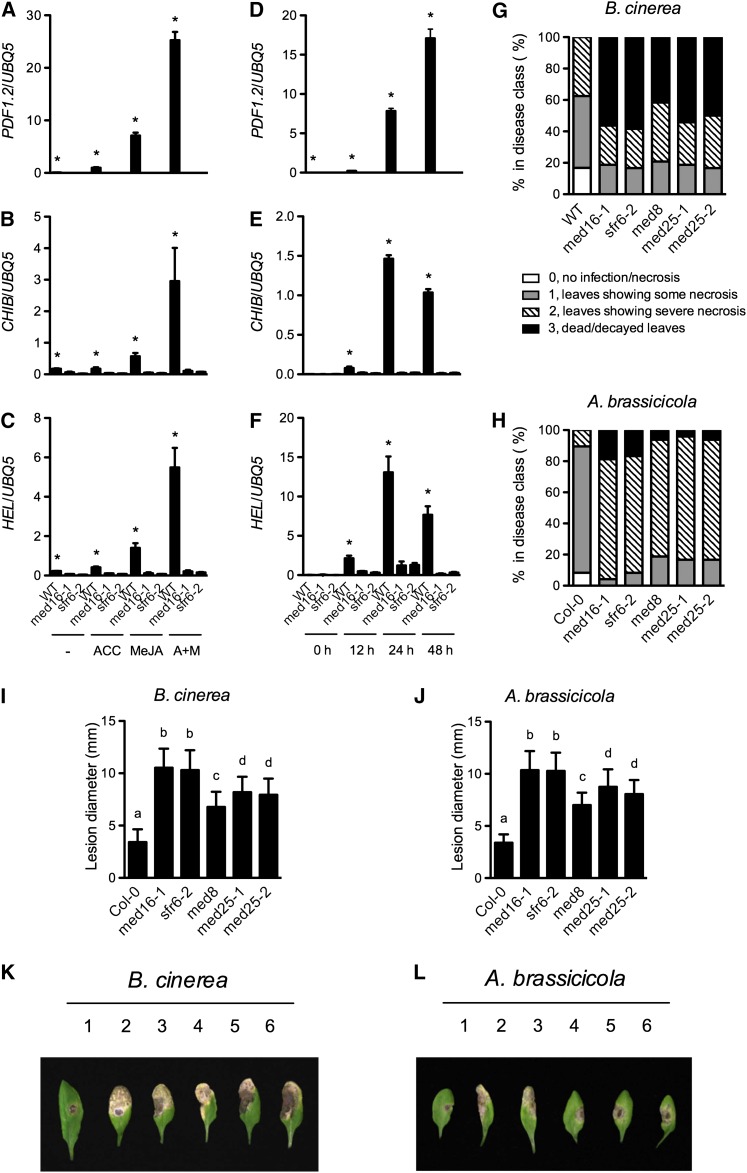
Figure 8.
Induction of JA/ET-Responsive Genes and Resistance to Necrotrophic Pathogens in med16/sfr6 Mutants.
(A) to (C) ACC- and MeJA-induced expression of PDF1.2, CHIB, and HEL in med16/sfr6 and wild-type (WT) plants. Ten-d-old seedlings grown on one-half–strength MS medium were transplanted onto one-half–strength MS medium (−) or one-half–strength MS medium supplemented with 0.1 mM of ACC, 0.1 mM of MeJA, or both (A+M). Total RNA was extracted from plant tissues except roots collected 24 h later and subjected to real-time qPCR analysis. The UBQ5 gene was used as a loading control.
(D) to (F) B. cinerea–induced expression of PDF1.2, CHIB, and HEL in med16/sfr6 and wild-type plants. Four-week-old soil-grown plants were inoculated with B. cinerea spores, and the inoculated leaves were collected at the indicated time points and analyzed as in (A).
(G) and (H) Growth of B. cinerea (G) or A. brassicicola (H) on med16/sfr6, med8, med25, and wild-type plants. Four-week-old soil-grown plants were inoculated with B. cinerea or A. brassicicola spores, and the inoculated leaves were scored 4 d later and classified according to the disease symptoms. A total of 64 leaves on 16 plants were scored for each genotype. Col-0, ecotype Columbia.
(I) and (J) Size of the necrotic lesions formed on B. cinerea–infected (I) or A. brassicicola–infected (J) med16/sfr6, med8, med25, and wild-type plants. Data represent the mean of lesion sizes on 36 leaves with sd. Different letters above the bars indicate significant differences (P < 0.05, Student’s t test).
(K) and (L) Symptoms on rosette leaves of 4-week-old soil-grown med16, med8, med25, and wild-type plants inoculated with B. cinerea (K) or A. brassicicola (L) spores. Photos were taken 4 d after inoculation. 1: the wild type; 2: med16-1; 3: sfr6-2; 4: med8; 5: med25-1; 6: med25-2. An asterisk (*) in (A) to (F) indicates that the expression level of the gene in the wild type was significantly higher than in both med16-1 and sfr6-2 (P < 0.05, Student’s t test). The comparison was made separately between the wild type and med16-1 or sfr6-2 for each time point or treatment. All experiments were repeated with similar results.

