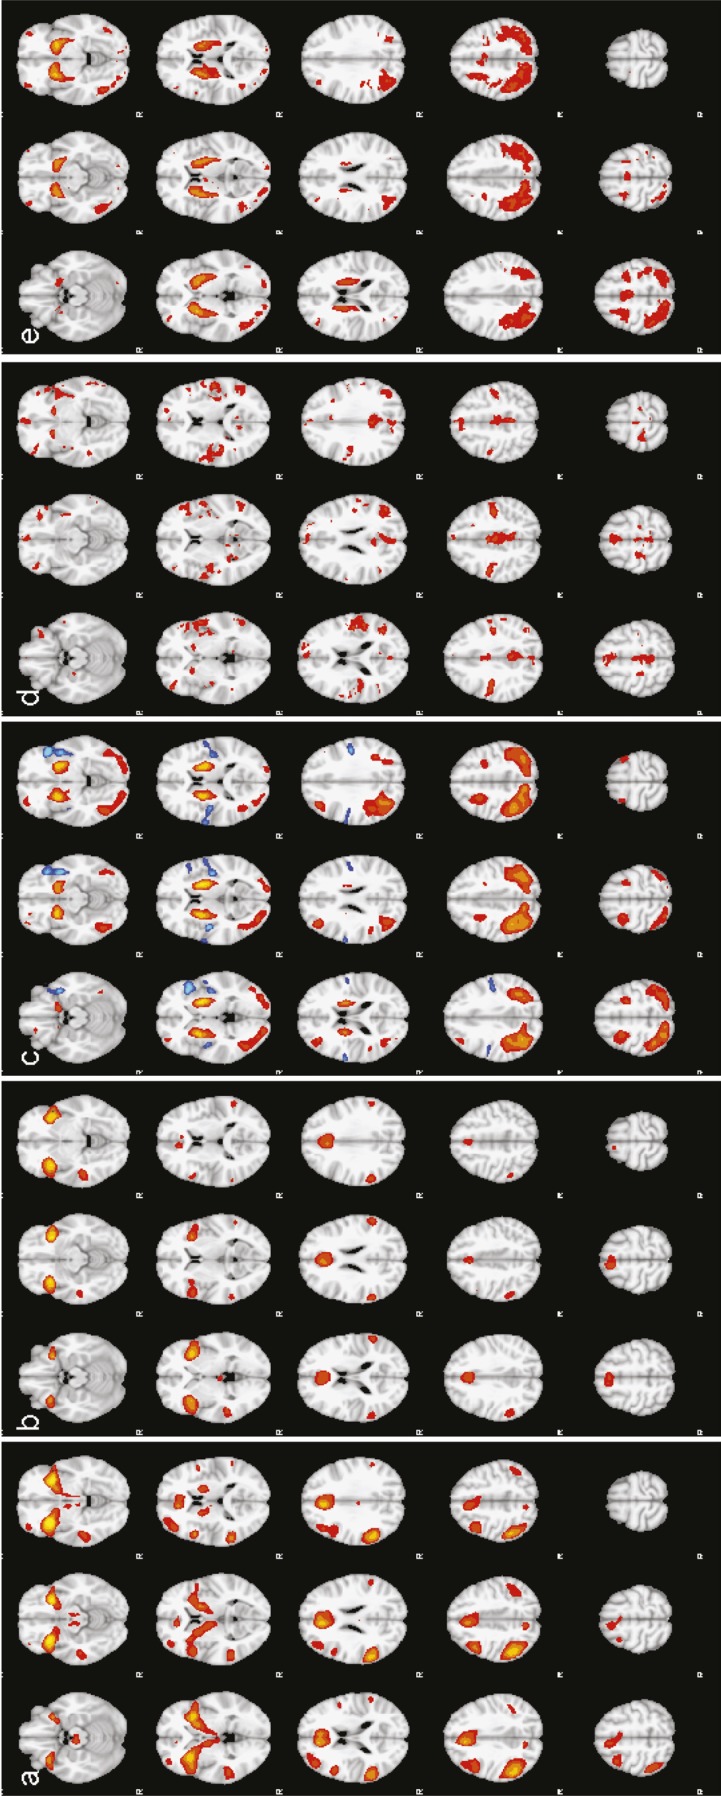
Figure 1.
Group effects of contrasts in the Go/NoGo task, (a) NoGo correct > Go correct (z > 10, p < .05). (b) NoGo correct > Go correct (z > 10, p < .05). (c) NoGo correct > NoGo Incorrect (yellow/orange; z > 5, p < .05) and NoGo Incorrect > NoGo correct (blue; z > 3.09, p < .05). (d) Go trials before Error > Go trials before Correct Inhibition (z > 4.26, p < .05). (e) Go trials after Correct Inhibitions > Go trials after Errors (z > 7, p < .05). All images are in radiological convention.

