Figure 3.

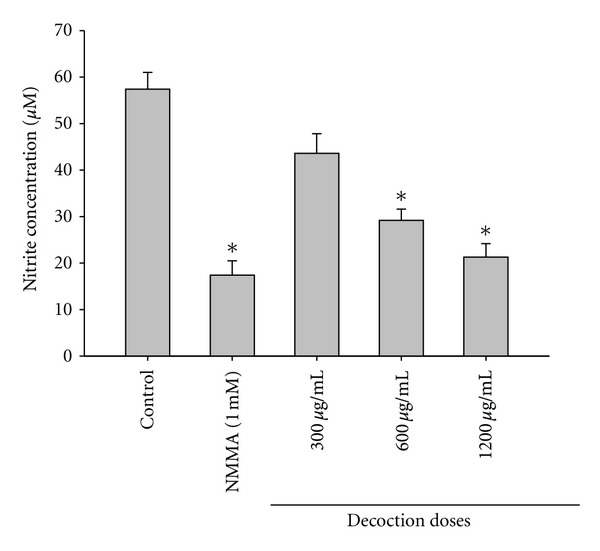
Effects of the decoction on in vitro NO production by rat peritoneal cells. Values are expressed as mean ± SEM, n = 6/concentration. *P < 0.05, when compared with control.

Effects of the decoction on in vitro NO production by rat peritoneal cells. Values are expressed as mean ± SEM, n = 6/concentration. *P < 0.05, when compared with control.